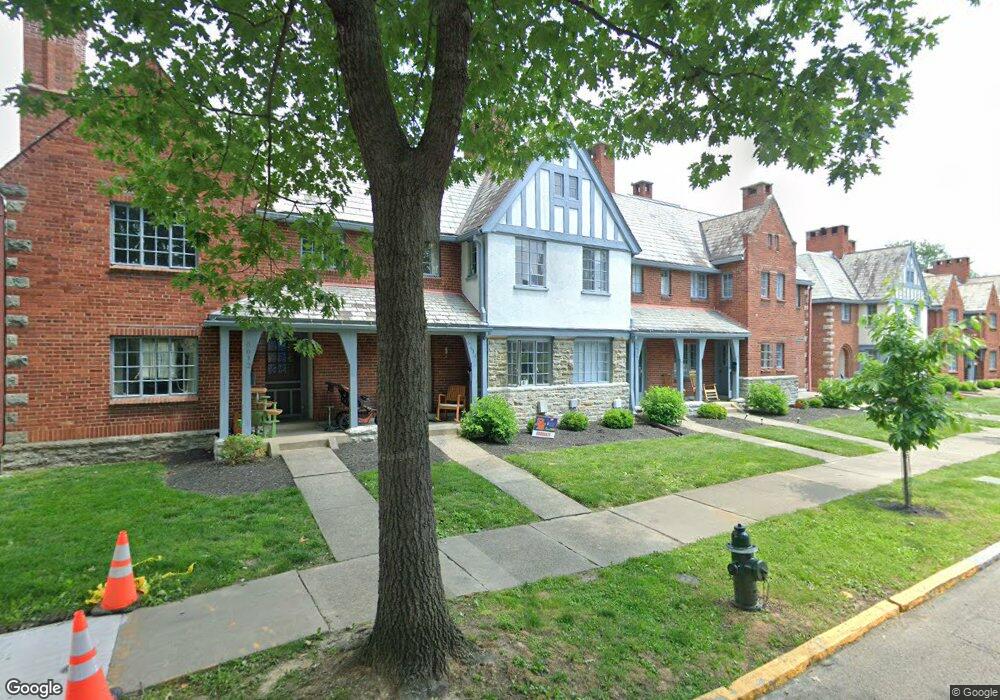
6616 Chestnut St Cincinnati, OH 45227
Estimated Value: $195,896 - $458,000
2
Beds
1
Bath
1,296
Sq Ft
$226/Sq Ft
Est. Value
About This Home
This home is located at 6616 Chestnut St, Cincinnati, OH 45227 and is currently estimated at $292,724, approximately $225 per square foot. 6616 Chestnut St is a home located in Hamilton County with nearby schools including Terrace Park Elementary School, Mariemont Elementary School, and Mariemont Junior High School.
Create a Home Valuation Report for This Property
The Home Valuation Report is an in-depth analysis detailing your home's value as well as a comparison with similar homes in the area
Home Values in the Area
Average Home Value in this Area
Tax History Compared to Growth
Tax History
| Year | Tax Paid | Tax Assessment Tax Assessment Total Assessment is a certain percentage of the fair market value that is determined by local assessors to be the total taxable value of land and additions on the property. | Land | Improvement |
|---|---|---|---|---|
| 2024 | $2,500 | $34,581 | $5,961 | $28,620 |
| 2023 | $2,274 | $34,581 | $5,961 | $28,620 |
| 2022 | $2,901 | $37,461 | $7,343 | $30,118 |
| 2021 | $2,886 | $37,461 | $7,343 | $30,118 |
| 2020 | $2,848 | $37,461 | $7,343 | $30,118 |
| 2019 | $2,750 | $32,858 | $6,440 | $26,418 |
| 2018 | $2,747 | $32,858 | $6,440 | $26,418 |
| 2017 | $2,380 | $32,858 | $6,440 | $26,418 |
| 2016 | $2,177 | $29,390 | $5,278 | $24,112 |
| 2015 | $2,167 | $29,390 | $5,278 | $24,112 |
| 2014 | $2,166 | $29,390 | $5,278 | $24,112 |
| 2013 | $1,802 | $25,554 | $4,589 | $20,965 |
Source: Public Records
Map
Nearby Homes
- 6576 Wooster Pike
- 3812 Carlton St
- 6219 Bedford St
- 6417 Bramble Ave
- 3690 Birkdale Ln
- 3645 Birkdale Ln
- St Martin Plan at Birkdale
- 3674 Birkdale Ln
- 3670 Birkdale Ln
- 6208 Bancroft St
- 3662 Birkdale Ln
- 4115 Homer Ave
- 6507 Britton Ave
- 6740 Britton Ave
- 6631 Merwin Ave
- 6917 Palmetto St
- 6949 Cambridge Ave
- 4404 Simpson Ave
- 3986 S Whetzel Ave
- 5809 Elder St
- 6618 Chestnut St
- 6620 Chestnut St
- 6624 Chestnut St
- 6626 Chestnut St
- 6628 Chestnut St
- 3902 Beech St
- 3904 Beech St
- 3906 Beech St
- 6630 Chestnut St
- 3908 Beech St
- 6615 Chestnut St
- 6632 Chestnut St
- 6623 Chestnut St
- 6607 Chestnut St
- 6625 Chestnut St
- 6605 Chestnut St
- 6634 Chestnut St
- 6333 Chestnut St
- 6612 Chestnut St
- 6612 Chestnut St