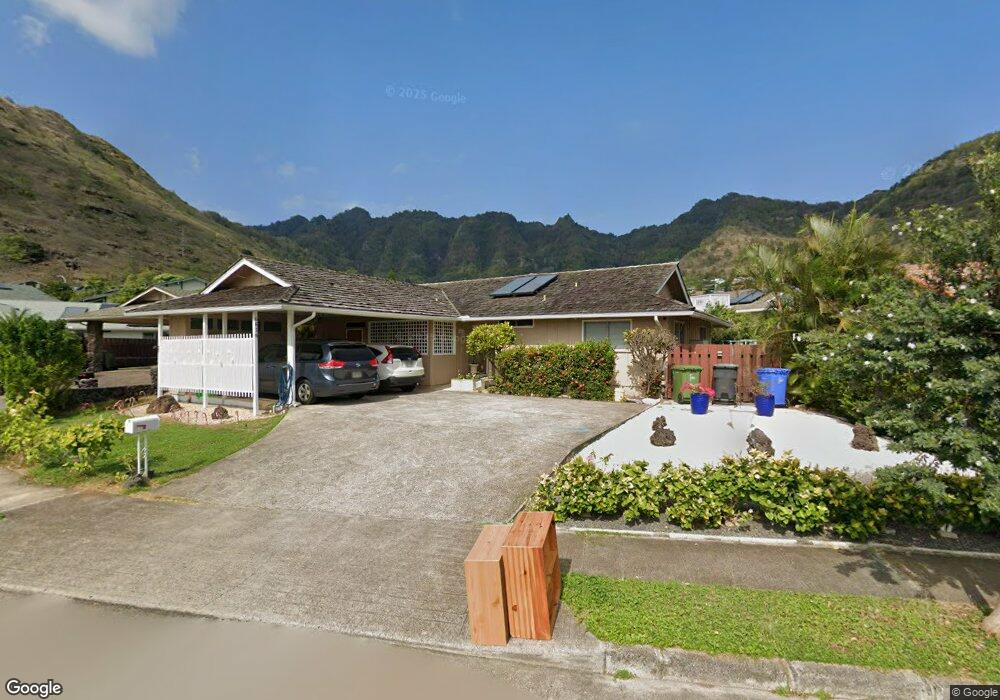
6616 Kii Place Honolulu, HI 96825
Hawaii Kai NeighborhoodEstimated Value: $1,396,319 - $1,517,000
3
Beds
2
Baths
1,344
Sq Ft
$1,078/Sq Ft
Est. Value
About This Home
This home is located at 6616 Kii Place, Honolulu, HI 96825 and is currently estimated at $1,449,330, approximately $1,078 per square foot. 6616 Kii Place is a home located in Honolulu County with nearby schools including Haha'ione Elementary School, Niu Valley Middle School, and Honolulu Waldorf School.
Ownership History
Date
Name
Owned For
Owner Type
Purchase Details
Closed on
Mar 28, 2006
Sold by
Kimura Spencer A and Kimura Lani Anne I
Bought by
Kimura Spencer Albert and Kimura Lani Anne Iyo
Current Estimated Value
Purchase Details
Closed on
Jul 25, 2002
Sold by
Crane Sheldon Cyr
Bought by
Kimura Spencer A and Kimura Lani Anne I
Home Financials for this Owner
Home Financials are based on the most recent Mortgage that was taken out on this home.
Original Mortgage
$327,200
Outstanding Balance
$137,624
Interest Rate
6.6%
Estimated Equity
$1,311,706
Purchase Details
Closed on
Dec 21, 1994
Sold by
Thompson Myron Bennett and Peters Henry Haalilio
Bought by
Crane Sheldon Cyr and Crane Jane Cooper
Home Financials for this Owner
Home Financials are based on the most recent Mortgage that was taken out on this home.
Original Mortgage
$117,344
Interest Rate
9.25%
Mortgage Type
Seller Take Back
Create a Home Valuation Report for This Property
The Home Valuation Report is an in-depth analysis detailing your home's value as well as a comparison with similar homes in the area
Home Values in the Area
Average Home Value in this Area
Purchase History
| Date | Buyer | Sale Price | Title Company |
|---|---|---|---|
| Kimura Spencer Albert | -- | None Available | |
| Kimura Spencer A | $409,000 | -- | |
| Crane Sheldon Cyr | $123,500 | -- |
Source: Public Records
Mortgage History
| Date | Status | Borrower | Loan Amount |
|---|---|---|---|
| Open | Kimura Spencer A | $327,200 | |
| Previous Owner | Crane Sheldon Cyr | $117,344 |
Source: Public Records
Tax History Compared to Growth
Tax History
| Year | Tax Paid | Tax Assessment Tax Assessment Total Assessment is a certain percentage of the fair market value that is determined by local assessors to be the total taxable value of land and additions on the property. | Land | Improvement |
|---|---|---|---|---|
| 2025 | $3,609 | $1,126,200 | $983,900 | $142,300 |
| 2024 | $3,609 | $1,151,000 | $958,000 | $193,000 |
| 2023 | $3,827 | $1,293,300 | $958,000 | $335,300 |
| 2022 | $3,518 | $1,105,200 | $880,300 | $224,900 |
| 2021 | $2,784 | $895,400 | $766,400 | $129,000 |
| 2020 | $2,813 | $903,800 | $766,400 | $137,400 |
| 2019 | $2,949 | $922,600 | $756,100 | $166,500 |
| 2018 | $2,793 | $878,000 | $745,700 | $132,300 |
| 2017 | $2,680 | $845,600 | $693,900 | $151,700 |
| 2016 | $2,627 | $830,600 | $652,500 | $178,100 |
| 2015 | $2,510 | $797,000 | $626,600 | $170,400 |
| 2014 | $2,126 | $736,900 | $585,200 | $151,700 |
Source: Public Records
Map
Nearby Homes
- 856 Kii St
- 730 Ainapo St
- 665 Hahaione St
- 612 Ainapo St
- 555 Hahaione St Unit 5E
- 555 Hahaione St Unit 12D
- 1048 Kaupaku Place
- 928 Hokulani St
- 521 Pepeekeo St Unit 8
- 553 Pepeekeo St Unit 436CA
- 521 Hahaione St Unit 2/6H
- 521 Hahaione St Unit 10G
- 521 Hahaione St Unit 26J
- 501 Hahaione St Unit 119J
- 521 Hahaione St Unit 217H
- 521 Hahaione St Unit 12J
- 521 Hahaione St Unit 215L
- 531 Hahaione St Unit 2/1A
- 531 Hahaione St Unit 2/19B
- 531 Hahaione St Unit 2/9A