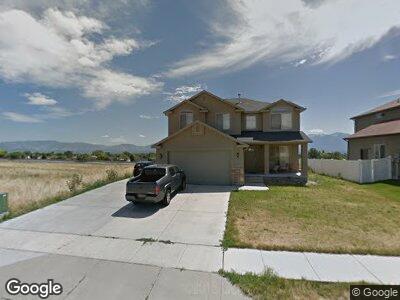
6617 Adventure Way West Jordan, UT 84081
Oquirrh NeighborhoodEstimated Value: $540,000 - $628,177
4
Beds
3
Baths
3,110
Sq Ft
$194/Sq Ft
Est. Value
About This Home
This home is located at 6617 Adventure Way, West Jordan, UT 84081 and is currently estimated at $602,044, approximately $193 per square foot. 6617 Adventure Way is a home located in Salt Lake County with nearby schools including Falcon Ridge School, Sunset Ridge Middle School, and Copper Hills High School.
Ownership History
Date
Name
Owned For
Owner Type
Purchase Details
Closed on
Aug 7, 2015
Sold by
Valencia Nelly and Tafur Genaro
Bought by
Valencia Nelly and Valencia Nicholas
Current Estimated Value
Home Financials for this Owner
Home Financials are based on the most recent Mortgage that was taken out on this home.
Original Mortgage
$50,000
Outstanding Balance
$31,307
Interest Rate
3.98%
Mortgage Type
Credit Line Revolving
Estimated Equity
$593,493
Purchase Details
Closed on
Oct 20, 2009
Sold by
Suncrest Ridge #4 Development Company Ll
Bought by
Valencia Nelly and Tafur Genaro
Home Financials for this Owner
Home Financials are based on the most recent Mortgage that was taken out on this home.
Original Mortgage
$140,000
Interest Rate
4.44%
Mortgage Type
New Conventional
Purchase Details
Closed on
Jun 17, 2009
Sold by
Steffensen David
Bought by
Rfr Holdings Llc
Purchase Details
Closed on
Mar 25, 2005
Sold by
Pettit Glen R
Bought by
Suncrest Ridge #4 Development Co Llc
Create a Home Valuation Report for This Property
The Home Valuation Report is an in-depth analysis detailing your home's value as well as a comparison with similar homes in the area
Home Values in the Area
Average Home Value in this Area
Purchase History
| Date | Buyer | Sale Price | Title Company |
|---|---|---|---|
| Valencia Nelly | -- | Bonneville Superior Title | |
| Valencia Nelly | -- | Utah Mountain Title | |
| Suncrest Ridge #4 Development Co Llc | -- | Merrill Title |
Source: Public Records
Mortgage History
| Date | Status | Borrower | Loan Amount |
|---|---|---|---|
| Open | Valencia Nelly | $50,000 | |
| Closed | Valencia Nelly | $20,000 | |
| Closed | Valencia Nelly | $140,000 |
Source: Public Records
Tax History Compared to Growth
Tax History
| Year | Tax Paid | Tax Assessment Tax Assessment Total Assessment is a certain percentage of the fair market value that is determined by local assessors to be the total taxable value of land and additions on the property. | Land | Improvement |
|---|---|---|---|---|
| 2023 | $3,403 | $540,400 | $140,900 | $399,500 |
| 2022 | $0 | $566,000 | $138,200 | $427,800 |
| 2021 | $3,149 | $461,500 | $106,300 | $355,200 |
| 2020 | $2,923 | $400,100 | $98,600 | $301,500 |
| 2019 | $2,924 | $391,500 | $93,000 | $298,500 |
| 2018 | $2,751 | $363,500 | $93,000 | $270,500 |
| 2017 | $2,649 | $344,800 | $93,000 | $251,800 |
| 2016 | $2,719 | $333,000 | $86,100 | $246,900 |
| 2015 | $2,368 | $279,800 | $92,600 | $187,200 |
| 2014 | $2,307 | $267,700 | $89,700 | $178,000 |
Source: Public Records
Map
Nearby Homes
- 6706 Adventure Way
- 5582 Joshua Cir
- 5472 Aristada Ave
- 5373 W 6600 S
- 5370 W Cadenza Dr
- 5961 W Chiswick Ct
- 6680 S Leichen Ct
- 6734 S Firenze Place
- 6959 S Adventure Way
- 6470 S Wakefield Way
- 5885 Jackling Way
- 6097 W Cedar Hill Rd
- 6439 S Clernates Dr
- 5964 W Jackling Way
- 6088 W Graceland Way
- 5976 W 7000 S
- 6135 W Mount Montana Dr
- 6153 S 5725 W
- 6568 S 5180 W
- 6116 W Graceland Way
- 6617 Adventure Way
- 6627 S Adventure Way
- 6627 Adventure Way
- 6622 Adventure Way
- 6637 Adventure Way
- 5674 W 6655 S
- 5708 W 6635 S
- 6646 Adventure Way
- 5718 W 6635 S
- 6658 S Adventure Way
- 6658 Adventure Way
- 5711 W 6635 S
- 5667 W 6655 S
- 5677 W 6655 S
- 5655 W 6655 S
- 5728 W 6635 S
- 6674 Adventure Way
- 5723 W 6635 S
- 5722 W Moon Crest Ct
- 5722 Moon Crest Ct