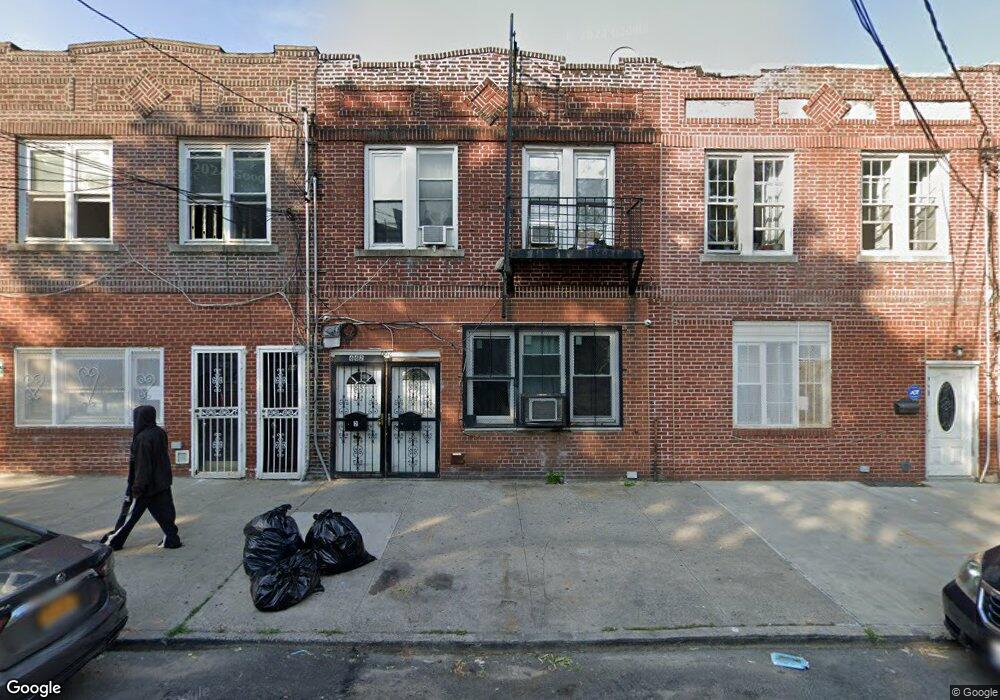
662 E 188th St Bronx, NY 10458
Belmont NeighborhoodEstimated Value: $818,733 - $1,042,000
Studio
--
Bath
2,380
Sq Ft
$382/Sq Ft
Est. Value
About This Home
This home is located at 662 E 188th St, Bronx, NY 10458 and is currently estimated at $908,933, approximately $381 per square foot. 662 E 188th St is a home located in Bronx County with nearby schools including P.S. 205 Fiorello LaGuardia and Thomas C Giordano Middleschool 45.
Ownership History
Date
Name
Owned For
Owner Type
Purchase Details
Closed on
Apr 30, 2002
Sold by
Penman Carlos
Bought by
Webster Victor and Webbe Realty Inc
Current Estimated Value
Home Financials for this Owner
Home Financials are based on the most recent Mortgage that was taken out on this home.
Original Mortgage
$223,250
Interest Rate
6.92%
Purchase Details
Closed on
Aug 2, 2001
Sold by
Sheiowitz Gerald Ref and Vasquez Fanny Deft Et A
Bought by
S K Mortgage Investment
Purchase Details
Closed on
Jan 24, 1998
Sold by
Altieri Thomas and Altieri Antoinette
Bought by
Vasquez Fanny and Perez Carlos
Home Financials for this Owner
Home Financials are based on the most recent Mortgage that was taken out on this home.
Original Mortgage
$128,835
Interest Rate
6.9%
Mortgage Type
FHA
Create a Home Valuation Report for This Property
The Home Valuation Report is an in-depth analysis detailing your home's value as well as a comparison with similar homes in the area
Home Values in the Area
Average Home Value in this Area
Purchase History
| Date | Buyer | Sale Price | Title Company |
|---|---|---|---|
| Webster Victor | -- | -- | |
| Penman Carlos | -- | -- | |
| S K Mortgage Investment | -- | -- | |
| Vasquez Fanny | $130,000 | Title Agency |
Source: Public Records
Mortgage History
| Date | Status | Borrower | Loan Amount |
|---|---|---|---|
| Previous Owner | Penman Carlos | $223,250 | |
| Previous Owner | Vasquez Fanny | $128,835 |
Source: Public Records
Tax History
| Year | Tax Paid | Tax Assessment Tax Assessment Total Assessment is a certain percentage of the fair market value that is determined by local assessors to be the total taxable value of land and additions on the property. | Land | Improvement |
|---|---|---|---|---|
| 2025 | $4,435 | $24,889 | $3,789 | $21,100 |
| 2024 | $4,435 | $23,480 | $3,526 | $19,954 |
| 2023 | $4,215 | $22,152 | $3,848 | $18,304 |
| 2022 | $3,886 | $39,120 | $7,380 | $31,740 |
| 2021 | $4,096 | $38,460 | $7,380 | $31,080 |
| 2020 | $4,094 | $42,480 | $7,380 | $35,100 |
| 2019 | $3,800 | $39,120 | $7,380 | $31,740 |
| 2018 | $3,465 | $18,460 | $4,317 | $14,143 |
| 2017 | $3,251 | $17,418 | $4,539 | $12,879 |
| 2016 | $3,172 | $17,418 | $5,113 | $12,305 |
| 2015 | $1,762 | $17,284 | $7,638 | $9,646 |
| 2014 | $1,762 | $16,306 | $6,494 | $9,812 |
Source: Public Records
Map
Nearby Homes
- 2420 Cambreleng Ave
- 2471 Crotona Ave
- 2445 Southern Blvd
- 2459 Hoffman St Unit 2461
- 2469 Hoffman St
- 2319 Prospect Ave
- 45-44 E 189th St
- 554 E 191st St Unit 1,2,3
- 2301 Bathgate Ave
- 620 E 182nd St
- 505 E 183rd St
- 506 E 183rd St
- 2158 Hughes Ave
- 2259 Bassford Ave
- 2255 Bathgate Ave
- 446 E 186th St
- 2249 Bassford Ave
- 805 E 182nd St Unit 4E
- 2120 Clinton Ave
- 2139 Mapes Ave
- 664 E 188th St
- 660 E 188th St
- 666 E 188th St
- 658 E 188th St
- 656 E 188th St
- 2423 Cambreleng Ave
- 2421 Cambreleng Ave
- 654 E 188th St
- 654 E 188th St Unit First Floor
- 654 E 188th St Unit 2
- 654 E 188th St Unit 1
- 652 E 188 St
- 652 E 188th St
- 2419 Cambreleng Ave
- 2418 Belmont Ave
- 2417 Cambreleng Ave
- 2420-2428 Belmont Ave
- 2413 Cambreleng Ave
- 2414 Belmont Ave
- 663 E 188th St
Your Personal Tour Guide
Ask me questions while you tour the home.