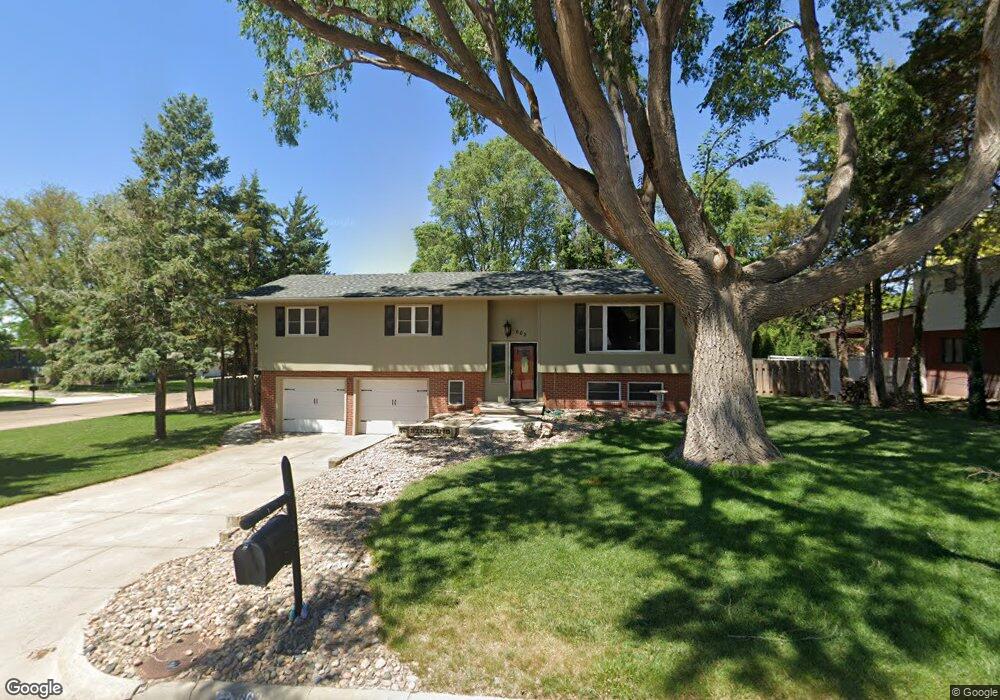
662 Wheatridge Rd Garden City, KS 67846
Estimated Value: $379,253 - $441,000
4
Beds
4
Baths
1,971
Sq Ft
$203/Sq Ft
Est. Value
About This Home
This home is located at 662 Wheatridge Rd, Garden City, KS 67846 and is currently estimated at $399,813, approximately $202 per square foot. 662 Wheatridge Rd is a home located in Finney County with nearby schools including Jennie Wilson Elementary School, Horace J. Good Middle School, and Charles O. Stones Intermediate Center.
Ownership History
Date
Name
Owned For
Owner Type
Purchase Details
Closed on
Nov 16, 2007
Sold by
Fuller Timothy L and Fuller Susan R
Bought by
Stocking Blake D and Stocking Robin M
Current Estimated Value
Home Financials for this Owner
Home Financials are based on the most recent Mortgage that was taken out on this home.
Original Mortgage
$177,660
Outstanding Balance
$112,407
Interest Rate
6.38%
Mortgage Type
New Conventional
Estimated Equity
$287,406
Purchase Details
Closed on
Dec 12, 2006
Sold by
Citifinaicla Mortgage Inc
Bought by
Fuller Timothy L and Fuller Susan R
Home Financials for this Owner
Home Financials are based on the most recent Mortgage that was taken out on this home.
Original Mortgage
$125,000
Interest Rate
6.31%
Mortgage Type
Future Advance Clause Open End Mortgage
Purchase Details
Closed on
Apr 17, 2006
Sold by
Jones Roy M
Bought by
Citifinancial Inc
Create a Home Valuation Report for This Property
The Home Valuation Report is an in-depth analysis detailing your home's value as well as a comparison with similar homes in the area
Home Values in the Area
Average Home Value in this Area
Purchase History
| Date | Buyer | Sale Price | Title Company |
|---|---|---|---|
| Stocking Blake D | -- | None Available | |
| Fuller Timothy L | -- | None Available | |
| Citifinancial Inc | -- | None Available |
Source: Public Records
Mortgage History
| Date | Status | Borrower | Loan Amount |
|---|---|---|---|
| Open | Stocking Blake D | $177,660 | |
| Previous Owner | Fuller Timothy L | $125,000 |
Source: Public Records
Tax History Compared to Growth
Tax History
| Year | Tax Paid | Tax Assessment Tax Assessment Total Assessment is a certain percentage of the fair market value that is determined by local assessors to be the total taxable value of land and additions on the property. | Land | Improvement |
|---|---|---|---|---|
| 2024 | $8,040 | $48,745 | $3,849 | $44,896 |
| 2023 | $8,040 | $45,556 | $3,849 | $41,707 |
| 2022 | $6,759 | $41,509 | $3,849 | $37,660 |
| 2021 | $5,606 | $34,179 | $3,849 | $30,330 |
| 2020 | $5,096 | $31,647 | $3,849 | $27,798 |
| 2019 | $4,933 | $31,205 | $3,849 | $27,356 |
| 2018 | $4,881 | $31,011 | $3,849 | $27,162 |
| 2017 | $4,546 | $0 | $0 | $0 |
| 2016 | $4,324 | $0 | $0 | $0 |
| 2015 | $4,156 | $0 | $0 | $0 |
| 2012 | -- | $0 | $0 | $0 |
Source: Public Records
Map
Nearby Homes
- 807 E Price St
- 624 Briar Hill Dr
- 610 E Price St
- 2106 N Belmont Place Unit 4
- 2303 N 3rd St
- 2010 N Belmont Place
- 1101 E Mary St
- 2505 N Carriage Ln
- 2504 N Carriage Ln
- 106 E Hamline St
- 2614 N 7th St
- 1709 Parkwood Ln
- 2001 Bison Dr
- 2601 N Main St
- 2002 A St
- 1809 N Main St
- 1706 Prairie Park Ln
- 1517 E Johnson St
- 1705 N Main St
- 1505 E Melanie Ln
- 658 Wheatridge Rd
- 637 Briar Hill Dr
- 806 E Thompson St
- 663 Wheatridge Rd
- 654 Wheatridge Rd
- 804 E Thompson St
- 808 E Thompson St
- 633 Briar Hill Dr
- 659 Wheatridge Rd
- 2208 Briar Hill Dr
- 810 E Thompson St
- 655 Wheatridge Rd
- 650 Wheatridge Rd
- 631 Briar Hill Dr
- 904 E Thompson St
- 809 E Price St
- 811 E Price St
- 636 Briar Hill Dr
- 905 E Thompson St
- 813 E Price St