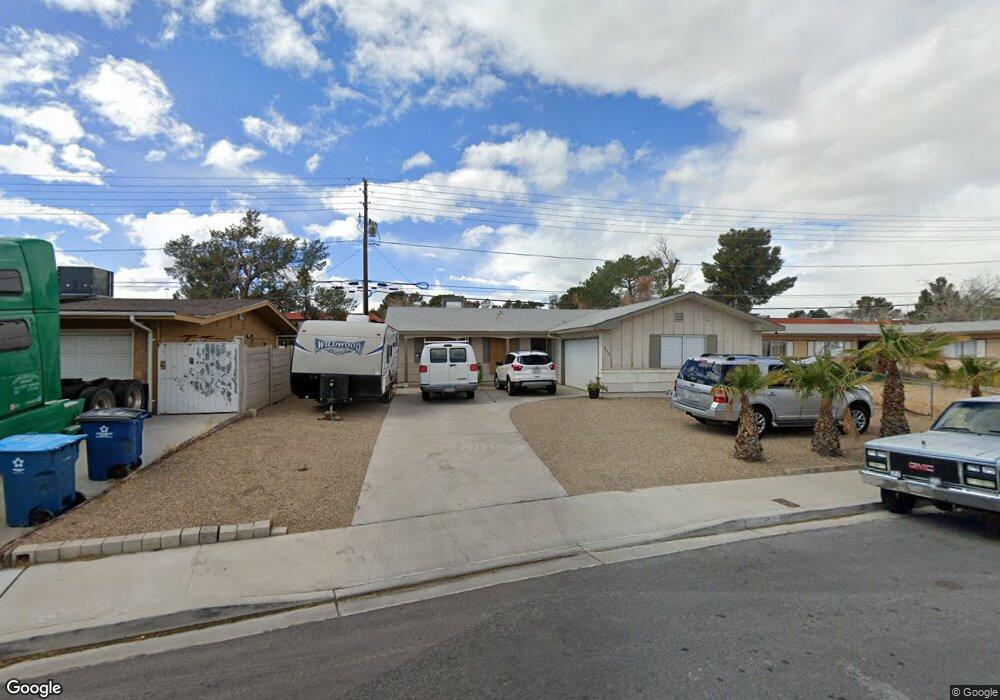
6620 Bubbling Brook Dr Unit 80 Las Vegas, NV 89107
Michael Way NeighborhoodEstimated Value: $224,318
2
Beds
1
Bath
968
Sq Ft
$232/Sq Ft
Est. Value
About This Home
This home is located at 6620 Bubbling Brook Dr Unit 80, Las Vegas, NV 89107 and is currently priced at $224,318, approximately $231 per square foot. 6620 Bubbling Brook Dr Unit 80 is a home located in Clark County with nearby schools including Vail Pittman Elementary School, Frank F Garside Junior High School, and Western High School.
Ownership History
Date
Name
Owned For
Owner Type
Purchase Details
Closed on
Jul 26, 2023
Sold by
Mj Real Estate Investments Llc
Bought by
Lytle Andrew
Current Estimated Value
Home Financials for this Owner
Home Financials are based on the most recent Mortgage that was taken out on this home.
Original Mortgage
$210,490
Outstanding Balance
$205,163
Interest Rate
6.69%
Mortgage Type
New Conventional
Purchase Details
Closed on
Apr 5, 2022
Sold by
Michael P Abram Living Trust
Bought by
Mj Real Estate Investments Llc
Home Financials for this Owner
Home Financials are based on the most recent Mortgage that was taken out on this home.
Original Mortgage
$161,100
Interest Rate
3.89%
Mortgage Type
New Conventional
Purchase Details
Closed on
Sep 10, 2011
Sold by
Abram Michael P
Bought by
Michael P Abram Living Trust
Purchase Details
Closed on
Feb 9, 2011
Sold by
U S Bank National Association
Bought by
Abram Michael P
Purchase Details
Closed on
Nov 18, 2010
Sold by
Luskin Michael
Bought by
U S Bank National Association
Purchase Details
Closed on
Apr 21, 2006
Sold by
Masciola Michael
Bought by
Masciola Linda
Home Financials for this Owner
Home Financials are based on the most recent Mortgage that was taken out on this home.
Original Mortgage
$31,800
Interest Rate
6.29%
Mortgage Type
Stand Alone Second
Purchase Details
Closed on
Apr 20, 2006
Sold by
Masciola Michael
Bought by
Luskin Michael
Home Financials for this Owner
Home Financials are based on the most recent Mortgage that was taken out on this home.
Original Mortgage
$31,800
Interest Rate
6.29%
Mortgage Type
Stand Alone Second
Purchase Details
Closed on
Oct 17, 2005
Sold by
Masciola Linda
Bought by
Masciola Michael
Home Financials for this Owner
Home Financials are based on the most recent Mortgage that was taken out on this home.
Original Mortgage
$110,000
Interest Rate
9.1%
Mortgage Type
New Conventional
Purchase Details
Closed on
Sep 8, 2001
Sold by
Morgan Beverly J
Bought by
Morgan Beverly J and Beverly J Morgan Trust
Purchase Details
Closed on
Oct 6, 1997
Sold by
Gerkey Francis Charles
Bought by
Brunick Patrick O
Home Financials for this Owner
Home Financials are based on the most recent Mortgage that was taken out on this home.
Original Mortgage
$50,700
Interest Rate
7.44%
Mortgage Type
FHA
Create a Home Valuation Report for This Property
The Home Valuation Report is an in-depth analysis detailing your home's value as well as a comparison with similar homes in the area
Home Values in the Area
Average Home Value in this Area
Purchase History
| Date | Buyer | Sale Price | Title Company |
|---|---|---|---|
| Lytle Andrew | $217,000 | Equity Title | |
| Mj Real Estate Investments Llc | $179,000 | Equity Title | |
| Michael P Abram Living Trust | -- | None Available | |
| Abram Michael P | $29,000 | Chicago Title Las Vegas | |
| U S Bank National Association | $33,750 | Lsi Title Agency Inc | |
| Masciola Linda | -- | First Amer Title Co Of Nv | |
| Luskin Michael | $159,000 | First Amer Title Co Of Nv | |
| Masciola Michael | $137,500 | Ticor Title Of Nevada Inc | |
| Masciola Michael | $137,500 | Ticor Title Of Nevada Inc | |
| Morgan Beverly J | -- | -- | |
| Brunick Patrick O | $52,000 | Fidelity National Title | |
| Gerkey Francis Charles | -- | Fidelity National Title |
Source: Public Records
Mortgage History
| Date | Status | Borrower | Loan Amount |
|---|---|---|---|
| Open | Lytle Andrew | $210,490 | |
| Previous Owner | Mj Real Estate Investments Llc | $161,100 | |
| Previous Owner | Luskin Michael | $31,800 | |
| Previous Owner | Luskin Michael | $127,200 | |
| Previous Owner | Masciola Michael | $110,000 | |
| Previous Owner | Gerkey Francis Charles | $50,700 |
Source: Public Records
Tax History Compared to Growth
Tax History
| Year | Tax Paid | Tax Assessment Tax Assessment Total Assessment is a certain percentage of the fair market value that is determined by local assessors to be the total taxable value of land and additions on the property. | Land | Improvement |
|---|---|---|---|---|
| 2025 | $556 | $30,669 | $18,900 | $11,769 |
| 2024 | $516 | $30,669 | $18,900 | $11,769 |
| 2023 | $516 | $32,314 | $21,350 | $10,964 |
| 2022 | $478 | $26,938 | $16,450 | $10,488 |
| 2021 | $463 | $25,527 | $15,050 | $10,477 |
| 2020 | $427 | $24,367 | $13,650 | $10,717 |
| 2019 | $407 | $20,615 | $9,800 | $10,815 |
| 2018 | $388 | $17,296 | $6,650 | $10,646 |
| 2017 | $559 | $17,049 | $5,950 | $11,099 |
| 2016 | $369 | $15,516 | $4,200 | $11,316 |
| 2015 | $368 | $14,414 | $3,850 | $10,564 |
| 2014 | $356 | $11,648 | $2,100 | $9,548 |
Source: Public Records
Map
Nearby Homes
- 221 Brookside Ln Unit C
- 6651 Bubbling Brook Dr Unit A
- 6681 Bubbling Brook Dr Unit A
- 250 Shadybrook Ln Unit D
- 6630 Bubbling Brook Dr Unit C
- 300 Brookside Ln Unit D
- 311 Brookside Ln Unit B
- 321 Brookside Ln Unit A
- 6505 Hill View Ave
- 300 Duke Cir
- 525 Watkins Dr
- 608 Watkins Dr
- 304 N Torrey Pines Dr
- 6628 Celeste Ave
- 6521 Sugarpine Ln
- 709 Dolores Dr
- 814 Pepperwood Ln
- 100 S Crestline Dr Unit 3
- 705 N Torrey Pines Dr
- 6325 Lawton Ave
- 6620 Bubbling Brook Dr Unit E
- 6620 Bubbling Brook Dr Unit D
- 6620 Bubbling Brook Dr Unit B
- 6620 Bubbling Brook Dr Unit C
- 6620 Bubbling Brook Dr Unit A
- 201 Brookside Ln Unit 60
- 201 Brookside Ln Unit C
- 201 Brookside Ln Unit B
- 201 Brookside Ln Unit A
- 201 Brookside Ln Unit D
- 201 Brookside Ln Unit 201 B
- 211 Brookside Ln Unit B
- 211 Brookside Ln Unit D
- 211 Brookside Ln Unit A
- 211 Brookside Ln Unit C
- 6641 Bubbling Brook Dr Unit B
- 6641 Bubbling Brook Dr Unit A
- 6641 Bubbling Brook Dr Unit C
- 6641 Bubbling Brook Dr Unit D
- 6641 Bubbling Brook Dr Unit E