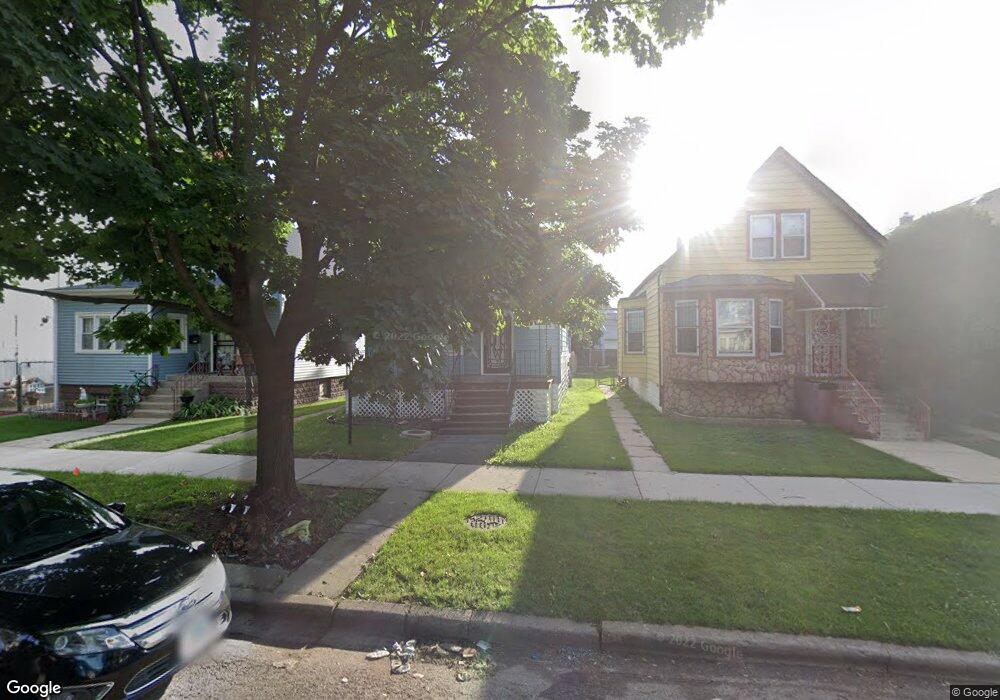
6620 S Claremont Ave Chicago, IL 60636
Englewood NeighborhoodEstimated Value: $161,451 - $235,000
4
Beds
2
Baths
1,504
Sq Ft
$131/Sq Ft
Est. Value
About This Home
This home is located at 6620 S Claremont Ave, Chicago, IL 60636 and is currently estimated at $196,363, approximately $130 per square foot. 6620 S Claremont Ave is a home located in Cook County with nearby schools including Claremont Academy Elementary School, Marquette School of Excellence, and Gage Park High School.
Ownership History
Date
Name
Owned For
Owner Type
Purchase Details
Closed on
Aug 6, 2019
Sold by
Red Barn Opportunity Fund Llc
Bought by
Stony Southside Rentals Llc
Current Estimated Value
Home Financials for this Owner
Home Financials are based on the most recent Mortgage that was taken out on this home.
Original Mortgage
$6,966,600
Interest Rate
3.7%
Mortgage Type
Commercial
Purchase Details
Closed on
Jan 2, 2019
Sold by
Waiyash Llc
Bought by
Red Barn Opportunity Fund Llc Series 2
Purchase Details
Closed on
Mar 9, 2018
Sold by
Community Initiatives Inc
Bought by
Waiyash Llc
Purchase Details
Closed on
Dec 22, 2017
Sold by
Fannie Mae
Bought by
Community Initiatives Inc
Purchase Details
Closed on
Jun 3, 2017
Sold by
Mack Marie
Bought by
Federal National Mortgage Association and United States Of America
Purchase Details
Closed on
Jun 19, 1996
Sold by
Alexander Marcia
Bought by
Alexander Johnny and Alexander Marcia
Create a Home Valuation Report for This Property
The Home Valuation Report is an in-depth analysis detailing your home's value as well as a comparison with similar homes in the area
Home Values in the Area
Average Home Value in this Area
Purchase History
| Date | Buyer | Sale Price | Title Company |
|---|---|---|---|
| Stony Southside Rentals Llc | -- | None Available | |
| Red Barn Opportunity Fund Llc Series 2 | -- | None Available | |
| Waiyash Llc | $22,000 | First American Title | |
| Community Initiatives Inc | $40,000 | First American Title | |
| Federal National Mortgage Association | -- | None Available | |
| Alexander Johnny | -- | -- |
Source: Public Records
Mortgage History
| Date | Status | Borrower | Loan Amount |
|---|---|---|---|
| Previous Owner | Stony Southside Rentals Llc | $6,966,600 |
Source: Public Records
Tax History Compared to Growth
Tax History
| Year | Tax Paid | Tax Assessment Tax Assessment Total Assessment is a certain percentage of the fair market value that is determined by local assessors to be the total taxable value of land and additions on the property. | Land | Improvement |
|---|---|---|---|---|
| 2024 | $1,060 | $7,501 | $1,238 | $6,263 |
| 2023 | $1,034 | $5,000 | $2,681 | $2,319 |
| 2022 | $1,034 | $5,000 | $2,681 | $2,319 |
| 2021 | $1,005 | $4,999 | $2,681 | $2,318 |
| 2020 | $1,959 | $8,739 | $2,681 | $6,058 |
| 2019 | $1,986 | $9,820 | $2,681 | $7,139 |
| 2018 | $1,952 | $9,820 | $2,681 | $7,139 |
| 2017 | $1,680 | $11,126 | $2,475 | $8,651 |
| 2016 | $1,740 | $11,126 | $2,475 | $8,651 |
| 2015 | $1,569 | $11,126 | $2,475 | $8,651 |
| 2014 | $1,423 | $10,180 | $2,268 | $7,912 |
| 2013 | $1,384 | $10,180 | $2,268 | $7,912 |
Source: Public Records
Map
Nearby Homes
- 6715 S Claremont Ave
- 6608 S Bell Ave
- 6716 S Bell Ave
- 6749 S Oakley Ave
- 6622 S Artesian Ave
- 6541 S Artesian Ave
- 6822 S Claremont Ave
- 6448 S Oakley Ave
- 6629 S Hamilton Ave
- 6545 S Hamilton Ave
- 6943 S Bell Ave
- 6741 S Maplewood Ave
- 6821 S Campbell Ave
- 6632 S Maplewood Ave
- 6734 S Maplewood Ave
- 6441 S Campbell Ave
- 6739 S Rockwell St
- 6808 S Maplewood Ave
- 2115 W 68th Place
- 6347 S Western Ave
- 6616 S Claremont Ave
- 6622 S Claremont Ave
- 6612 S Claremont Ave
- 6610 S Claremont Ave
- 6608 S Claremont Ave
- 6606 S Claremont Ave
- 6602 S Claremont Ave
- 6615 S Claremont Ave
- 6619 S Claremont Ave
- 6621 S Claremont Ave
- 6600 S Claremont Ave
- 6600 S Claremont Ave
- 6617 S Claremont Ave
- 6623 S Claremont Ave
- 6627 S Claremont Ave
- 6611 S Claremont Ave
- 6631 S Claremont Ave
- 6609 S Claremont Ave
- 6637 S Claremont Ave
- 6633 S Claremont Ave