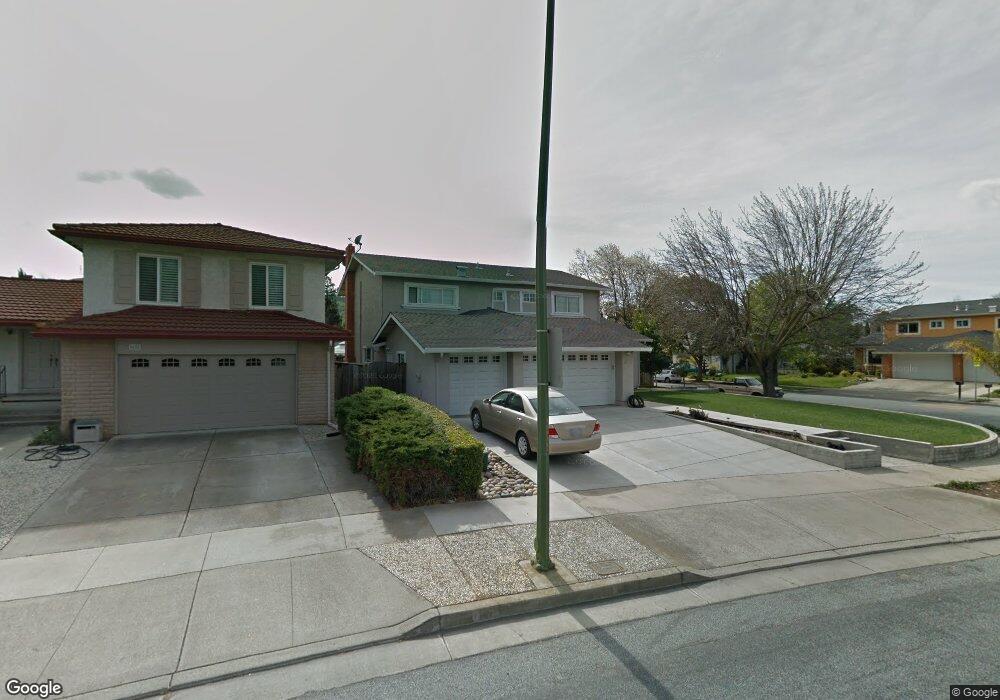
6621 Cielito Way San Jose, CA 95119
Rancho Santa Teresa NeighborhoodEstimated Value: $1,687,376 - $1,946,000
5
Beds
3
Baths
2,563
Sq Ft
$707/Sq Ft
Est. Value
About This Home
This home is located at 6621 Cielito Way, San Jose, CA 95119 and is currently estimated at $1,812,094, approximately $707 per square foot. 6621 Cielito Way is a home located in Santa Clara County with nearby schools including Baldwin (Julia) Elementary School, Bernal Intermediate School, and Santa Teresa High School.
Ownership History
Date
Name
Owned For
Owner Type
Purchase Details
Closed on
Apr 28, 2022
Sold by
Henry Hamamjy
Bought by
Hamamjy Family Trust
Current Estimated Value
Purchase Details
Closed on
Aug 16, 2010
Sold by
Hamamjy Henry
Bought by
Hamamjy Henry and Hamamjy Urhoy Zuka
Home Financials for this Owner
Home Financials are based on the most recent Mortgage that was taken out on this home.
Original Mortgage
$515,000
Interest Rate
4.52%
Mortgage Type
New Conventional
Purchase Details
Closed on
Oct 28, 2006
Sold by
Hamamjy Jack
Bought by
Hamamjy Henry
Home Financials for this Owner
Home Financials are based on the most recent Mortgage that was taken out on this home.
Original Mortgage
$150,000
Interest Rate
6.32%
Mortgage Type
Credit Line Revolving
Purchase Details
Closed on
Oct 18, 2006
Sold by
Hamamjy Rachelle
Bought by
Hamamjy Jack
Home Financials for this Owner
Home Financials are based on the most recent Mortgage that was taken out on this home.
Original Mortgage
$150,000
Interest Rate
6.32%
Mortgage Type
Credit Line Revolving
Purchase Details
Closed on
May 27, 2003
Sold by
Hamamjy Aida
Bought by
Hamamjy Jack
Home Financials for this Owner
Home Financials are based on the most recent Mortgage that was taken out on this home.
Original Mortgage
$465,600
Interest Rate
5.75%
Mortgage Type
Stand Alone First
Purchase Details
Closed on
Sep 17, 2002
Sold by
Senzig Michele J
Bought by
Senzig Craig D
Home Financials for this Owner
Home Financials are based on the most recent Mortgage that was taken out on this home.
Original Mortgage
$395,000
Interest Rate
5.5%
Purchase Details
Closed on
Jan 18, 2001
Sold by
Senzig Craig D
Bought by
Senzig Craig D and Senzig Michele J
Home Financials for this Owner
Home Financials are based on the most recent Mortgage that was taken out on this home.
Original Mortgage
$400,000
Interest Rate
7.87%
Purchase Details
Closed on
Dec 8, 2000
Sold by
Weintraub Cecil And Nanette Trustee
Bought by
Senzig Craig D
Home Financials for this Owner
Home Financials are based on the most recent Mortgage that was taken out on this home.
Original Mortgage
$400,000
Interest Rate
7.87%
Purchase Details
Closed on
Mar 23, 1996
Sold by
Weintraub Cecil and Weintraub Nanette
Bought by
Weintraub Cecil and Weintraub Nanette
Purchase Details
Closed on
Jan 26, 1995
Sold by
Weintraub Lloyd
Bought by
Weintraub Cecil and Weintraub Nanette
Purchase Details
Closed on
Dec 14, 1993
Sold by
Weintraub Cecil and Weintraub Nanette
Bought by
Weintraub Lloyd and Weintraub Laurel
Create a Home Valuation Report for This Property
The Home Valuation Report is an in-depth analysis detailing your home's value as well as a comparison with similar homes in the area
Home Values in the Area
Average Home Value in this Area
Purchase History
| Date | Buyer | Sale Price | Title Company |
|---|---|---|---|
| Hamamjy Family Trust | -- | Manfred & Hunt Llp | |
| Hamamjy Henry | -- | Old Republic Title Company | |
| Hamamjy Henry | -- | Alliance Title Company | |
| Hamamjy Jack | -- | Alliance Title | |
| Hamamjy Jack | -- | Chicago Title | |
| Hamamjy Jack | $582,000 | Chicago Title | |
| Senzig Craig D | -- | Stewart Title Of California | |
| Senzig Craig D | -- | -- | |
| Senzig Craig D | $610,000 | Chicago Title Co | |
| Weintraub Cecil | -- | -- | |
| Weintraub Cecil | -- | -- | |
| Weintraub Lloyd | -- | -- |
Source: Public Records
Mortgage History
| Date | Status | Borrower | Loan Amount |
|---|---|---|---|
| Previous Owner | Hamamjy Henry | $515,000 | |
| Previous Owner | Hamamjy Henry | $150,000 | |
| Previous Owner | Hamamjy Henry | $510,000 | |
| Previous Owner | Hamamjy Jack | $465,600 | |
| Previous Owner | Senzig Craig D | $395,000 | |
| Previous Owner | Senzig Craig D | $400,000 |
Source: Public Records
Tax History Compared to Growth
Tax History
| Year | Tax Paid | Tax Assessment Tax Assessment Total Assessment is a certain percentage of the fair market value that is determined by local assessors to be the total taxable value of land and additions on the property. | Land | Improvement |
|---|---|---|---|---|
| 2025 | $13,369 | $918,447 | $631,315 | $287,132 |
| 2024 | $13,369 | $900,439 | $618,937 | $281,502 |
| 2023 | $13,156 | $882,784 | $606,801 | $275,983 |
| 2022 | $12,969 | $865,475 | $594,903 | $270,572 |
| 2021 | $12,753 | $848,506 | $583,239 | $265,267 |
| 2020 | $12,413 | $839,807 | $577,259 | $262,548 |
| 2019 | $12,100 | $823,341 | $565,941 | $257,400 |
| 2018 | $12,004 | $807,198 | $554,845 | $252,353 |
| 2017 | $11,838 | $791,371 | $543,966 | $247,405 |
| 2016 | $11,271 | $775,854 | $533,300 | $242,554 |
| 2015 | $11,022 | $764,201 | $525,290 | $238,911 |
| 2014 | $9,814 | $749,233 | $515,001 | $234,232 |
Source: Public Records
Map
Nearby Homes
- 6624 Catamaran St
- 213 Purple Glen Dr
- 203 Pemba Ct
- 6554 Catamaran St
- 201 Bahia Ct
- 6579 Prague Ct
- 180 Kona Place
- 273 Jaggers Dr
- 237 Arbor Valley Dr
- 227 Martinvale Ln
- 277 Dondero Way
- 246 Castillon Way
- 299 Moraga Way
- 6375 San Anselmo Way
- 321 Vineyard Dr
- 6362 San Anselmo Way
- 207 New River Dr
- 150 Yasou Demas Way
- 6681 Optimum Loop
- 6689 Optimum Loop
- 6625 Cielito Way
- 6628 Catamaran St
- 6629 Cielito Way
- 6449 San Ignacio Ave
- 6455 San Ignacio Ave
- 6430 San Ignacio Ave
- 6633 Cielito Way
- 6461 San Ignacio Ave
- 6437 San Ignacio Ave
- 6636 Catamaran St
- 6431 San Ignacio Ave
- 6630 Cielito Way
- 6424 San Ignacio Ave
- 6637 Cielito Way
- 6604 Pemba Dr
- 6610 Pemba Dr
- 6598 Pemba Dr
- 6640 Catamaran St
- 6623 Catamaran St
- 6627 Catamaran St