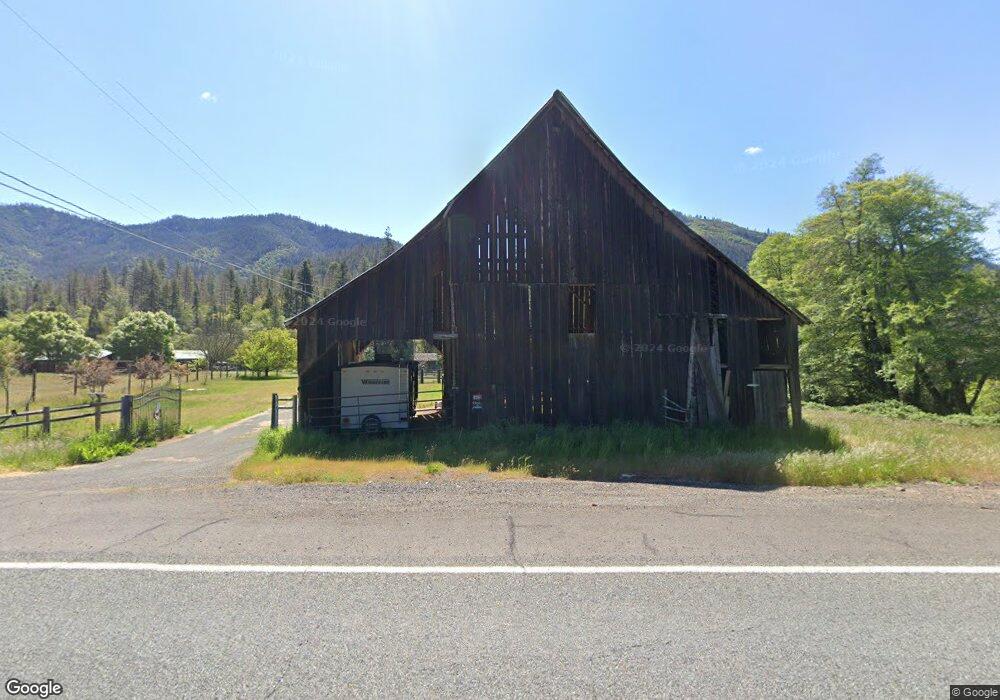
6621 Upper Applegate Rd Jacksonville, OR 97530
Estimated Value: $834,704 - $974,000
2
Beds
2
Baths
3,064
Sq Ft
$293/Sq Ft
Est. Value
About This Home
This home is located at 6621 Upper Applegate Rd, Jacksonville, OR 97530 and is currently estimated at $897,926, approximately $293 per square foot. 6621 Upper Applegate Rd is a home located in Jackson County with nearby schools including Ruch Outdoor Community School K-8, McLoughlin Middle School, and South Medford High School.
Ownership History
Date
Name
Owned For
Owner Type
Purchase Details
Closed on
Sep 12, 2018
Sold by
Dollison Philip E
Bought by
The Dollison Family Revocable Trust
Current Estimated Value
Purchase Details
Closed on
Mar 2, 2016
Sold by
Dollison Philip E
Bought by
Dollison Philip F
Purchase Details
Closed on
Feb 23, 2016
Sold by
Dollison Phil
Bought by
Dollison Family Trust
Purchase Details
Closed on
Feb 27, 2008
Sold by
Dollison Phillip F and Dollison Ann M
Bought by
Dollison Phillip E and Dollison Ann M
Home Financials for this Owner
Home Financials are based on the most recent Mortgage that was taken out on this home.
Original Mortgage
$150,000
Outstanding Balance
$91,221
Interest Rate
5.64%
Mortgage Type
Credit Line Revolving
Estimated Equity
$806,705
Purchase Details
Closed on
Mar 14, 1999
Sold by
London Robert S and London Heath H
Bought by
Dollison Philip F and Dollison Ann M
Create a Home Valuation Report for This Property
The Home Valuation Report is an in-depth analysis detailing your home's value as well as a comparison with similar homes in the area
Purchase History
| Date | Buyer | Sale Price | Title Company |
|---|---|---|---|
| The Dollison Family Revocable Trust | -- | None Available | |
| Dollison Philip F | -- | None Available | |
| Dollison Family Trust | -- | None Available | |
| Dollison Phillip E | -- | None Available | |
| Dollison Phillip F | -- | None Available | |
| Dollison Philip F | -- | Amerititle |
Source: Public Records
Mortgage History
| Date | Status | Borrower | Loan Amount |
|---|---|---|---|
| Open | Dollison Phillip F | $150,000 |
Source: Public Records
Tax History
| Year | Tax Paid | Tax Assessment Tax Assessment Total Assessment is a certain percentage of the fair market value that is determined by local assessors to be the total taxable value of land and additions on the property. | Land | Improvement |
|---|---|---|---|---|
| 2026 | $8,137 | $632,835 | -- | -- |
| 2025 | $7,968 | $663,386 | $277,166 | $386,220 |
| 2024 | $7,968 | $644,064 | $269,084 | $374,980 |
| 2023 | $7,600 | $625,313 | $261,243 | $364,070 |
| 2022 | $7,420 | $625,313 | $261,243 | $364,070 |
| 2021 | $7,235 | $607,101 | $253,631 | $353,470 |
| 2017 | $6,565 | $539,414 | $225,354 | $314,060 |
| 2016 | $6,446 | $508,489 | $212,439 | $296,050 |
Source: Public Records
Map
Nearby Homes
- 7813 Upper Applegate Rd
- 8060 Upper Applegate Rd
- 0 Dog Fork Rd Unit 220213091
- 0 R Fork Forest Creek Rd Unit 11555343
- 939 Beaver Creek Rd
- 3950 Little Applegate Rd
- 3356 Little Applegate Rd
- 3361 Little Applegate Rd
- 2389 Upper Applegate Rd
- 10376 Sterling Creek Rd
- 10250 Sterling Creek Rd
- 1979 Upper Applegate Rd
- 2525 Kinney Creek Rd
- 9511 Sterling Creek Rd
- 0 Rd Unit 400 220186721
- 1584 Yale Creek Rd
- 75 Anna Laura Rd
- 6585 Little Applegate Rd
- 588 Upper Applegate Rd
- 324 China Gulch Rd
- 6621 Upper Applegate Rd
- 6621 Upp Applegate
- 6731 Upper Applegate Rd
- 6791 Upper Applegate Rd
- 2282 Eastside Rd
- 2365 Eastside Rd
- 0 Eastside Rd
- 290 Star Gulch Rd Unit A
- 6500 Upper Applegate Rd
- 2398 Eastside Rd
- 7105 Upper Applegate Rd
- 1665 Eastside Rd
- 7105 Upp Applegate
- 2575 Eastside Rd
- 2561 Eastside Rd
- 2571 Eastside Rd
- 7128 Upper Applegate Rd
- 2555 Eastside Rd
- 7151 Upper Applegate Rd
- 7219 Upper Applegate Rd
Your Personal Tour Guide
Ask me questions while you tour the home.