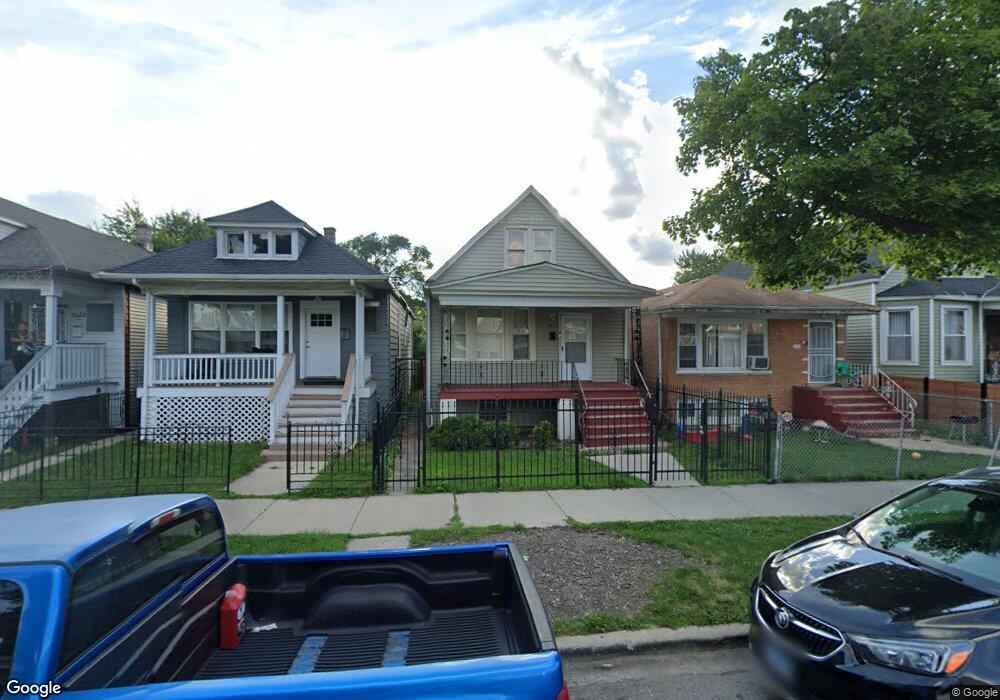
6622 S Oakley Ave Chicago, IL 60636
Englewood NeighborhoodEstimated Value: $107,009 - $225,000
3
Beds
1
Bath
1,386
Sq Ft
$119/Sq Ft
Est. Value
About This Home
This home is located at 6622 S Oakley Ave, Chicago, IL 60636 and is currently estimated at $165,502, approximately $119 per square foot. 6622 S Oakley Ave is a home located in Cook County with nearby schools including Claremont Academy Elementary School, Marquette School of Excellence, and Gage Park High School.
Ownership History
Date
Name
Owned For
Owner Type
Purchase Details
Closed on
Jun 10, 2005
Sold by
Nhs Redevelopment Corp
Bought by
Randolph Lepoleon and Larue Lisa
Current Estimated Value
Home Financials for this Owner
Home Financials are based on the most recent Mortgage that was taken out on this home.
Original Mortgage
$99,500
Outstanding Balance
$54,722
Interest Rate
6.6%
Mortgage Type
Unknown
Estimated Equity
$110,780
Purchase Details
Closed on
Dec 9, 2004
Sold by
Wachovia Bank Na
Bought by
Nhs Redevelopment Corp
Purchase Details
Closed on
Sep 27, 2004
Sold by
Phillips Antonio
Bought by
Wachovia Bank Na and Long Beach Mortgage Trust 2002-2
Purchase Details
Closed on
Mar 11, 2002
Sold by
Bennett Ollie and Bennett Sandra
Bought by
Phillips Antonio
Home Financials for this Owner
Home Financials are based on the most recent Mortgage that was taken out on this home.
Original Mortgage
$59,500
Interest Rate
11.4%
Create a Home Valuation Report for This Property
The Home Valuation Report is an in-depth analysis detailing your home's value as well as a comparison with similar homes in the area
Home Values in the Area
Average Home Value in this Area
Purchase History
| Date | Buyer | Sale Price | Title Company |
|---|---|---|---|
| Randolph Lepoleon | $99,500 | Multiple | |
| Nhs Redevelopment Corp | $63,000 | Ticor Title | |
| Wachovia Bank Na | -- | Attorneys Title Guaranty Fun | |
| Phillips Antonio | $70,000 | Law Title |
Source: Public Records
Mortgage History
| Date | Status | Borrower | Loan Amount |
|---|---|---|---|
| Open | Randolph Lepoleon | $99,500 | |
| Previous Owner | Phillips Antonio | $59,500 |
Source: Public Records
Tax History Compared to Growth
Tax History
| Year | Tax Paid | Tax Assessment Tax Assessment Total Assessment is a certain percentage of the fair market value that is determined by local assessors to be the total taxable value of land and additions on the property. | Land | Improvement |
|---|---|---|---|---|
| 2024 | $144 | $5,601 | $938 | $4,663 |
| 2023 | $119 | $4,000 | $2,031 | $1,969 |
| 2022 | $119 | $4,000 | $2,031 | $1,969 |
| 2021 | $134 | $3,999 | $2,031 | $1,968 |
| 2020 | $931 | $7,280 | $2,031 | $5,249 |
| 2019 | $954 | $8,180 | $2,031 | $6,149 |
| 2018 | $937 | $8,180 | $2,031 | $6,149 |
| 2017 | $1,129 | $8,618 | $1,875 | $6,743 |
| 2016 | $1,226 | $8,618 | $1,875 | $6,743 |
| 2015 | $1,099 | $8,618 | $1,875 | $6,743 |
| 2014 | $1,108 | $8,539 | $1,718 | $6,821 |
| 2013 | $1,075 | $8,539 | $1,718 | $6,821 |
Source: Public Records
Map
Nearby Homes
- 6608 S Bell Ave
- 6715 S Claremont Ave
- 6716 S Bell Ave
- 6749 S Oakley Ave
- 6622 S Artesian Ave
- 6541 S Artesian Ave
- 6629 S Hamilton Ave
- 6448 S Oakley Ave
- 6545 S Hamilton Ave
- 6822 S Claremont Ave
- 6943 S Bell Ave
- 6632 S Maplewood Ave
- 6741 S Maplewood Ave
- 6821 S Campbell Ave
- 6441 S Campbell Ave
- 6734 S Maplewood Ave
- 2115 W 68th Place
- 6347 S Western Ave
- 6739 S Rockwell St
- 6423 S Hoyne Ave
- 6620 S Oakley Ave
- 6626 S Oakley Ave
- 6628 S Oakley Ave
- 6618 S Oakley Ave
- 6630 S Oakley Ave
- 6616 S Oakley Ave
- 6612 S Oakley Ave
- 6634 S Oakley Ave
- 6610 S Oakley Ave
- 6623 S Claremont Ave
- 6621 S Claremont Ave
- 6627 S Claremont Ave
- 6638 S Oakley Ave
- 6619 S Claremont Ave
- 6608 S Oakley Ave
- 6631 S Claremont Ave
- 6617 S Claremont Ave
- 6621 S Oakley Ave
- 6640 S Oakley Ave
- 6633 S Claremont Ave