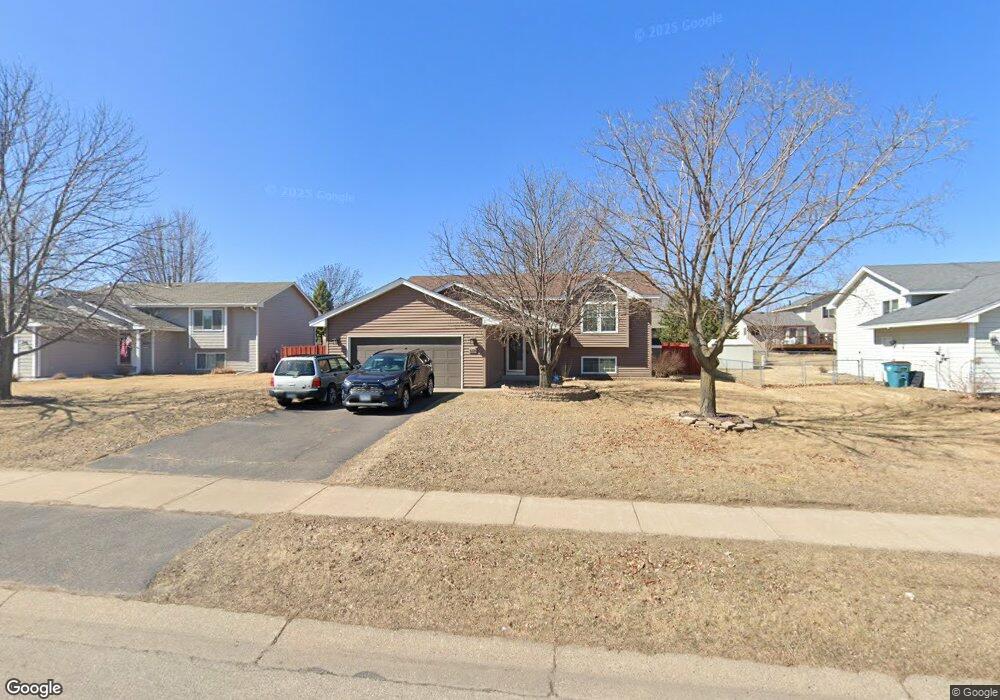
6624 Neddersen Pkwy Brooklyn Park, MN 55445
Tessman NeighborhoodEstimated Value: $388,412 - $419,000
4
Beds
2
Baths
1,106
Sq Ft
$367/Sq Ft
Est. Value
About This Home
This home is located at 6624 Neddersen Pkwy, Brooklyn Park, MN 55445 and is currently estimated at $405,853, approximately $366 per square foot. 6624 Neddersen Pkwy is a home located in Hennepin County with nearby schools including Edinbrook Elementary School, North View Middle School, and Osseo Senior High School.
Ownership History
Date
Name
Owned For
Owner Type
Purchase Details
Closed on
Sep 5, 2019
Sold by
Mascio John H and Mascio Iris
Bought by
Vue Ngia and Vue Francisco Florencia
Current Estimated Value
Home Financials for this Owner
Home Financials are based on the most recent Mortgage that was taken out on this home.
Original Mortgage
$289,750
Outstanding Balance
$253,275
Interest Rate
3.5%
Mortgage Type
New Conventional
Estimated Equity
$152,578
Purchase Details
Closed on
Sep 16, 2016
Sold by
Fliger David and Fliger Amy L
Bought by
Mascio Iris and Mascio John H
Home Financials for this Owner
Home Financials are based on the most recent Mortgage that was taken out on this home.
Original Mortgage
$269,942
Interest Rate
3.25%
Mortgage Type
FHA
Purchase Details
Closed on
Jul 9, 2013
Sold by
Reinhardt Andrew Joel
Bought by
Reinhardt Amy Lynn
Purchase Details
Closed on
Apr 24, 1998
Sold by
Stulken Ryan J and Stulken Dena D
Bought by
Cofield Arthur A and Cofield Phaedra
Create a Home Valuation Report for This Property
The Home Valuation Report is an in-depth analysis detailing your home's value as well as a comparison with similar homes in the area
Home Values in the Area
Average Home Value in this Area
Purchase History
| Date | Buyer | Sale Price | Title Company |
|---|---|---|---|
| Vue Ngia | $305,000 | Titlesmart Inc | |
| Mascio Iris | -- | All American Title | |
| Mascio Iris | $275,000 | Home Title Inc | |
| Reinhardt Amy Lynn | -- | None Available | |
| Cofield Arthur A | $138,900 | -- |
Source: Public Records
Mortgage History
| Date | Status | Borrower | Loan Amount |
|---|---|---|---|
| Open | Vue Ngia | $289,750 | |
| Previous Owner | Mascio Iris | $269,942 |
Source: Public Records
Tax History Compared to Growth
Tax History
| Year | Tax Paid | Tax Assessment Tax Assessment Total Assessment is a certain percentage of the fair market value that is determined by local assessors to be the total taxable value of land and additions on the property. | Land | Improvement |
|---|---|---|---|---|
| 2024 | $5,195 | $365,700 | $120,000 | $245,700 |
| 2023 | $5,098 | $371,800 | $120,000 | $251,800 |
| 2022 | $4,221 | $370,300 | $120,000 | $250,300 |
| 2021 | $3,780 | $308,300 | $68,000 | $240,300 |
| 2020 | $3,823 | $279,700 | $68,000 | $211,700 |
| 2019 | $3,708 | $268,700 | $68,000 | $200,700 |
| 2018 | $3,532 | $249,200 | $60,200 | $189,000 |
| 2017 | $3,367 | $217,800 | $60,200 | $157,600 |
| 2016 | $3,283 | $210,300 | $60,200 | $150,100 |
| 2015 | $3,141 | $197,500 | $50,200 | $147,300 |
| 2014 | -- | $186,200 | $50,200 | $136,000 |
Source: Public Records
Map
Nearby Homes
- 6508 88th Ave N
- 7216 89th Ave N
- 8614 Tessman Pkwy N
- 8657 Tessman Cir N
- 6236 Creekview Ln N
- 6614 84th Ct N
- 8576 S Maplebrook Cir
- 8357 Jersey Ave N
- 6523 84th Ct N Unit 6523
- 8775 Maplebrook Pkwy N
- 6415 84th Ct N
- 6526 83rd Ct N
- 8833 N Maplebrook Ct
- 6716 83rd Ave N
- 6517 83rd Ct N
- 9200 Woodhall Bay N
- 8526 S Maplebrook Cir
- 8233 Hampshire Ct N
- 5333 89th Crescent Cir N
- 8426 Yates Ave N
- 6632 Neddersen Pkwy
- 6616 Neddersen Pkwy
- 9012 Idaho Ave N
- 9006 Idaho Ave N
- 9018 Idaho Ave N
- 6608 Neddersen Pkwy
- 6640 Neddersen Pkwy
- 6617 Neddersen Pkwy
- 9000 Idaho Ave N
- 9024 Idaho Ave N
- 6633 Neddersen Pkwy
- 6600 Neddersen Pkwy
- 6609 Neddersen Pkwy
- 6641 Neddersen Pkwy
- 6617 Neddersen Pkwy
- 9030 Idaho Ave N
- 9007 Idaho Ave N
- 9001 Hampshire Ave N
- 6625 Neddersen Pkwy
- 6601 Neddersen Pkwy