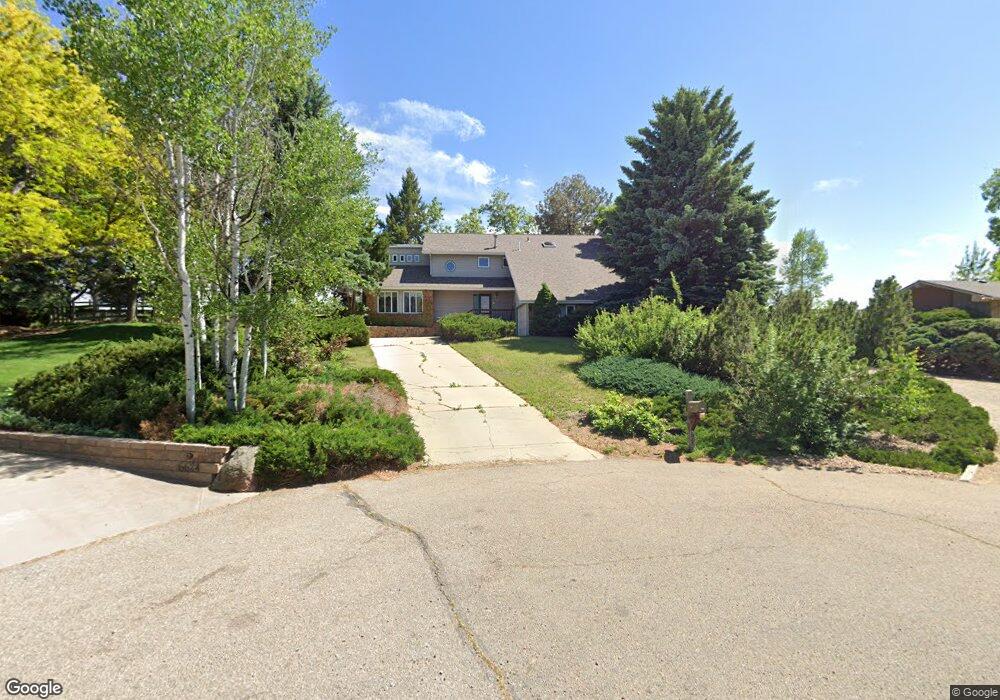
6625 Cherokee Ct Niwot, CO 80503
Niwot NeighborhoodEstimated Value: $1,242,000 - $1,710,000
4
Beds
4
Baths
2,826
Sq Ft
$504/Sq Ft
Est. Value
About This Home
This home is located at 6625 Cherokee Ct, Niwot, CO 80503 and is currently estimated at $1,424,520, approximately $504 per square foot. 6625 Cherokee Ct is a home located in Boulder County with nearby schools including Niwot Elementary School, Sunset Middle School, and Niwot High School.
Ownership History
Date
Name
Owned For
Owner Type
Purchase Details
Closed on
Jun 9, 1998
Sold by
Leisy Roger L and Leisy Roger
Bought by
Gabler Jeffrey R
Current Estimated Value
Home Financials for this Owner
Home Financials are based on the most recent Mortgage that was taken out on this home.
Original Mortgage
$278,960
Outstanding Balance
$56,877
Interest Rate
7.27%
Estimated Equity
$1,367,643
Purchase Details
Closed on
Jul 22, 1997
Sold by
Leisy Roger L
Bought by
Leisy Roger
Purchase Details
Closed on
Aug 23, 1993
Bought by
Gabler Jeffrey R and Gabler Karol K
Purchase Details
Closed on
Jun 27, 1989
Bought by
Gabler Jeffrey R and Gabler Karol K
Create a Home Valuation Report for This Property
The Home Valuation Report is an in-depth analysis detailing your home's value as well as a comparison with similar homes in the area
Home Values in the Area
Average Home Value in this Area
Purchase History
| Date | Buyer | Sale Price | Title Company |
|---|---|---|---|
| Gabler Jeffrey R | $348,700 | -- | |
| Leisy Roger | -- | -- | |
| Gabler Jeffrey R | $253,000 | -- | |
| Gabler Jeffrey R | -- | -- |
Source: Public Records
Mortgage History
| Date | Status | Borrower | Loan Amount |
|---|---|---|---|
| Open | Gabler Jeffrey R | $278,960 |
Source: Public Records
Tax History Compared to Growth
Tax History
| Year | Tax Paid | Tax Assessment Tax Assessment Total Assessment is a certain percentage of the fair market value that is determined by local assessors to be the total taxable value of land and additions on the property. | Land | Improvement |
|---|---|---|---|---|
| 2025 | $7,544 | $83,475 | $28,156 | $55,319 |
| 2024 | $7,544 | $83,475 | $28,156 | $55,319 |
| 2023 | $7,444 | $83,361 | $26,056 | $60,990 |
| 2022 | $6,790 | $66,713 | $23,449 | $43,264 |
| 2021 | $6,879 | $68,633 | $24,124 | $44,509 |
| 2020 | $6,282 | $62,827 | $18,018 | $44,809 |
| 2019 | $6,261 | $62,827 | $18,018 | $44,809 |
| 2018 | $5,535 | $55,951 | $13,536 | $42,415 |
| 2017 | $5,198 | $61,857 | $14,965 | $46,892 |
| 2016 | $5,212 | $54,932 | $16,079 | $38,853 |
| 2015 | $4,965 | $49,933 | $14,567 | $35,366 |
| 2014 | $5,124 | $49,933 | $14,567 | $35,366 |
Source: Public Records
Map
Nearby Homes
- 6668 Walker Ct
- 6541 Legend Ridge Trail
- 6557 Legend Ridge Trail
- 8942 Comanche Rd
- 8836 Marathon Rd
- 8748 Skyland Dr
- 8911 Little Raven Trail
- 8896 Niwot Rd
- 9261 Blue Spruce Ln
- 8840 Niwot Rd
- 6695 Blazing Star Ct
- 9260 Shooting Star Ct
- 6816 Goldbranch Dr
- 9258 Niwot Hills Dr
- 6851 Goldbranch Dr
- 8536 Foxhaven Ct
- 8568 Foxhaven Dr
- 8400 Sawtooth Ln
- 7204 Spring Creek Cir
- 7220 Spring Creek Cir
- 6624 Cherokee Ct
- 6635 Cherokee Ct
- 6644 Cherokee Ct
- 6645 Cherokee Ct
- 6623 Cheyenne Ct
- 6626 Apache Ct
- 6643 Cheyenne Ct
- 6664 Cherokee Ct
- 6646 Apache Ct
- 6663 Cheyenne Ct
- 6665 Cherokee Ct
- 6665 Cherokee Ct Unit 1
- 6613 Cheyenne Ct
- 6617 Apache Ct
- 8934 Walker Rd
- 6666 Apache Ct
- 8904 Walker Rd
- 6642 Cheyenne Ct
- 6622 Cheyenne Ct
- 6627 Apache Ct