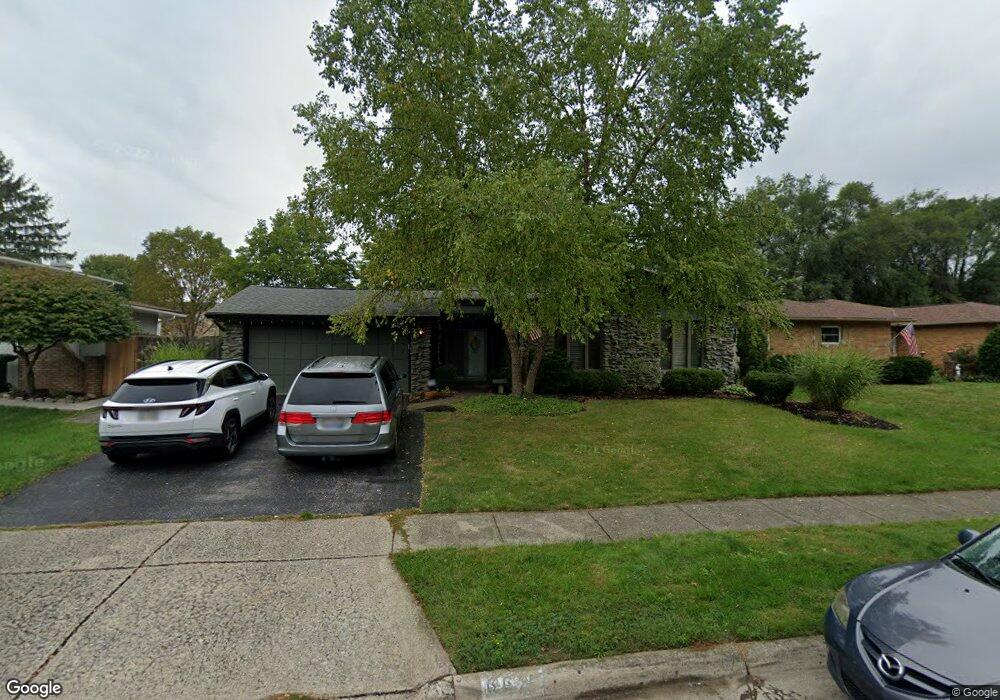
6625 Kennerdown St Columbus, OH 43229
Northgate NeighborhoodEstimated Value: $326,335 - $395,000
4
Beds
3
Baths
2,072
Sq Ft
$176/Sq Ft
Est. Value
About This Home
This home is located at 6625 Kennerdown St, Columbus, OH 43229 and is currently estimated at $364,334, approximately $175 per square foot. 6625 Kennerdown St is a home located in Franklin County with nearby schools including Northgate Intermediate, Alpine Elementary School, and Woodward Park Middle School.
Ownership History
Date
Name
Owned For
Owner Type
Purchase Details
Closed on
Mar 15, 2006
Sold by
Lewis Forrest B and Lewis Jodi
Bought by
Vodicka Tod A and Vodicka Patricia S
Current Estimated Value
Home Financials for this Owner
Home Financials are based on the most recent Mortgage that was taken out on this home.
Original Mortgage
$80,000
Outstanding Balance
$44,607
Interest Rate
6.33%
Mortgage Type
Fannie Mae Freddie Mac
Estimated Equity
$319,727
Purchase Details
Closed on
Apr 30, 2001
Sold by
Lovell Rollin B
Bought by
Lewis Forrest B and Lewis Jodi
Home Financials for this Owner
Home Financials are based on the most recent Mortgage that was taken out on this home.
Original Mortgage
$129,600
Outstanding Balance
$45,908
Interest Rate
6.99%
Estimated Equity
$318,427
Purchase Details
Closed on
Mar 23, 2001
Sold by
Estate Of Judy A Lovell
Bought by
Lovell Rollin B
Home Financials for this Owner
Home Financials are based on the most recent Mortgage that was taken out on this home.
Original Mortgage
$129,600
Outstanding Balance
$45,908
Interest Rate
6.99%
Estimated Equity
$318,427
Purchase Details
Closed on
Dec 14, 1983
Bought by
Lovell Rollin B
Create a Home Valuation Report for This Property
The Home Valuation Report is an in-depth analysis detailing your home's value as well as a comparison with similar homes in the area
Home Values in the Area
Average Home Value in this Area
Purchase History
| Date | Buyer | Sale Price | Title Company |
|---|---|---|---|
| Vodicka Tod A | $176,900 | Chicago Tit | |
| Lewis Forrest B | $162,000 | -- | |
| Lovell Rollin B | -- | -- | |
| Lovell Rollin B | $75,000 | -- |
Source: Public Records
Mortgage History
| Date | Status | Borrower | Loan Amount |
|---|---|---|---|
| Open | Vodicka Tod A | $80,000 | |
| Open | Lewis Forrest B | $129,600 |
Source: Public Records
Tax History
| Year | Tax Paid | Tax Assessment Tax Assessment Total Assessment is a certain percentage of the fair market value that is determined by local assessors to be the total taxable value of land and additions on the property. | Land | Improvement |
|---|---|---|---|---|
| 2025 | $3,985 | $88,800 | $21,420 | $67,380 |
| 2024 | $3,985 | $88,800 | $21,420 | $67,380 |
| 2023 | $3,934 | $88,795 | $21,420 | $67,375 |
| 2022 | $3,146 | $60,660 | $14,210 | $46,450 |
| 2021 | $3,152 | $60,660 | $14,210 | $46,450 |
| 2020 | $3,156 | $60,660 | $14,210 | $46,450 |
| 2019 | $2,926 | $48,240 | $11,380 | $36,860 |
| 2018 | $2,872 | $48,240 | $11,380 | $36,860 |
| 2017 | $3,018 | $48,240 | $11,380 | $36,860 |
| 2016 | $3,111 | $46,970 | $11,690 | $35,280 |
| 2015 | $2,824 | $46,970 | $11,690 | $35,280 |
| 2014 | $2,831 | $46,970 | $11,690 | $35,280 |
| 2013 | $1,471 | $49,455 | $12,320 | $37,135 |
Source: Public Records
Map
Nearby Homes
- 1946 Rockdale Dr Unit 57
- 2095 Willowick Dr Unit C
- 1800 Lakehill Ct
- 1755 Hillandale Ave
- 6348 Birkewood St
- 6425 Deer Ridge Ln
- 2022-2024 Jewett Dr
- 2125 Keltonshire Ave
- 2154-2156 Jewett Dr
- 1635 Tendril Ct
- 6245 Sharon Woods Blvd
- 6162 Hanby Square E
- 1806 Balsamridge Rd
- 6416 Faircrest Rd
- 2326 Laurelwood Dr Unit 2
- 6148 Sharon Woods Blvd
- 2534 Home Acre Dr Unit 34
- 6048 Pinemoor St
- 1421 Bosworth Place
- 5972 Maple Canyon Ave
- 6635 Kennerdown St
- 6615 Kennerdown St
- 6636 Sharon Woods Blvd
- 6626 Sharon Woods Blvd
- 6645 Kennerdown St
- 6644 Sharon Woods Blvd
- 2000 Brookhurst Ave
- 6618 Sharon Woods Blvd
- 6628 Kennerdown St
- 6620 Kennerdown St
- 6654 Sharon Woods Blvd
- 6608 Kennerdown St
- 6655 Kennerdown St
- 6610 Sharon Woods Blvd
- 6632 Belleshire St
- 6660 Sharon Woods Blvd
- 6663 Kennerdown St
- 2034 Brookhurst Ave
- 1980 Willow Glen Ln
- 6648 Kennerdown St
Your Personal Tour Guide
Ask me questions while you tour the home.