
Seller's Agent in 2025
Leroy Holt
SOLR REALTY
(310) 864-9440
2 in this area
33 Total Sales
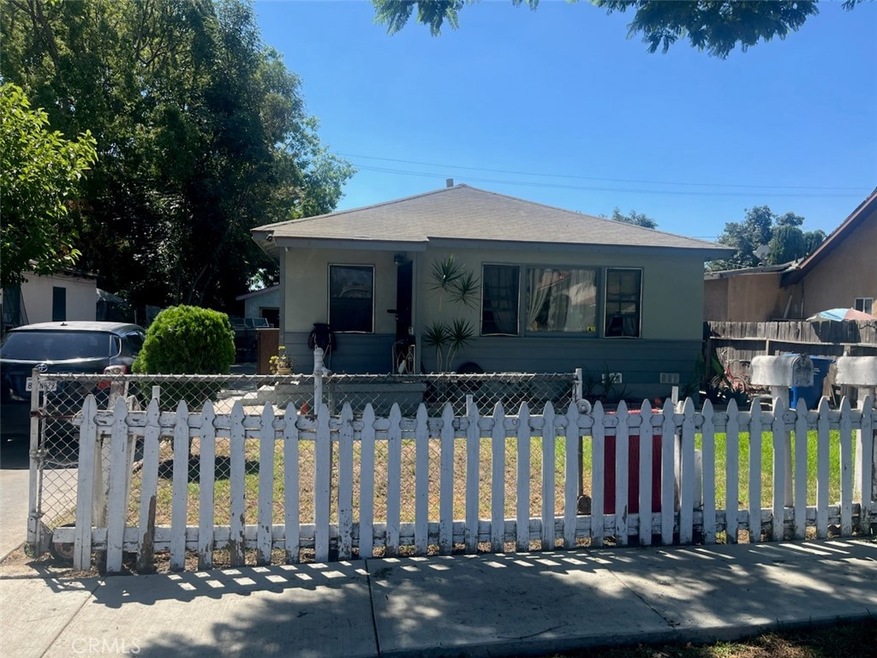


Investor Special!!! Excellent income-producing opportunity! 6626 San Miguel St. offers two units plus ADU potential in a prime Paramount location.
• Front Unit: 2 bedrooms, 1 bath with spacious layout.
• Rear Unit: 1 bedroom, 1 bath, perfect rental or guest quarters.
• Bonus Value-Add: A two-car garage with potential for an ADU conversion above, creating the opportunity for a third rental unit and additional cash flow.
This versatile property is ideal for investors seeking stable rental income with future upside. Live in one unit and rent the others, or maximize returns by leasing all units. The large lot and flexible layout open the door to multiple investment strategies.
Conveniently located near schools, shopping, dining, and freeway access, this property is well-positioned for strong tenant demand.
Don’t miss this chance to expand your portfolio with a multi-unit property that offers both immediate rental income and long-term growth potential!
Last Agent to Sell the Property
SOLR REALTY Brokerage Phone: 310-864-9440 License #01748776 Listed on: 09/11/2025
Last Buyer's Agent
SOLR REALTY Brokerage Phone: 310-864-9440 License #01748776 Listed on: 09/11/2025
| Date | Type | Sale Price | Title Company |
|---|---|---|---|
| Grant Deed | $553,000 | Chicago Title | |
| Grant Deed | -- | Pacific Coast Title | |
| Interfamily Deed Transfer | -- | None Available | |
| Interfamily Deed Transfer | -- | -- | |
| Corporate Deed | $130,500 | South Coast Title | |
| Trustee Deed | $168,524 | World Title Company |
| Date | Status | Loan Amount | Loan Type |
|---|---|---|---|
| Open | $498,000 | New Conventional | |
| Previous Owner | $126,550 | Seller Take Back |
| Date | Event | Price | List to Sale | Price per Sq Ft |
|---|---|---|---|---|
| 11/05/2025 11/05/25 | Sold | $545,000 | -18.7% | $376 / Sq Ft |
| 09/23/2025 09/23/25 | Pending | -- | -- | -- |
| 09/11/2025 09/11/25 | For Sale | $670,000 | -- | $463 / Sq Ft |
| Year | Tax Paid | Tax Assessment Tax Assessment Total Assessment is a certain percentage of the fair market value that is determined by local assessors to be the total taxable value of land and additions on the property. | Land | Improvement |
|---|---|---|---|---|
| 2025 | $5,149 | $709,920 | $479,400 | $230,520 |
| 2024 | $5,149 | $366,379 | $254,099 | $112,280 |
| 2023 | $5,056 | $359,196 | $249,117 | $110,079 |
| 2022 | $4,925 | $352,154 | $244,233 | $107,921 |
| 2021 | $4,812 | $345,250 | $239,445 | $105,805 |
| 2020 | $4,709 | $341,711 | $236,990 | $104,721 |
| 2019 | $4,926 | $335,012 | $232,344 | $102,668 |
| 2018 | $4,577 | $328,444 | $227,789 | $100,655 |
| 2016 | $4,117 | $315,693 | $218,945 | $96,748 |
| 2015 | $3,889 | $310,952 | $215,657 | $95,295 |
| 2014 | $3,986 | $304,862 | $211,433 | $93,429 |
Seller's Agent in 2025
Leroy Holt
SOLR REALTY
(310) 864-9440
2 in this area
33 Total Sales
Source: California Regional Multiple Listing Service (CRMLS)
MLS Number: IV25215423
APN: 6237-022-006
Disclaimer: Certain information contained herein is derived from information provided by parties other than Homes.com. All information provided is deemed reliable, but is not guaranteed to be accurate and should be independently verified.
![]() The multiple listing data appearing on this website, or contained in reports produced therefrom, is owned and copyrighted by California Regional Multiple Listing Service, Inc. ("CRMLS") and is protected by all applicable copyright laws. Information provided is for viewer's personal, non-commercial use and may not be used for any purpose other than to identify prospective properties the viewer may be interested in purchasing. All listing data, including but not limited to square footage and lot size is believed to be accurate, but the listing Agent, listing Broker and CRMLS and its affiliates do not warrant or guarantee such accuracy. The viewer should independently verify the listed data prior to making any decisions based on such information by personal inspection and/or contacting a real estate professional.
The multiple listing data appearing on this website, or contained in reports produced therefrom, is owned and copyrighted by California Regional Multiple Listing Service, Inc. ("CRMLS") and is protected by all applicable copyright laws. Information provided is for viewer's personal, non-commercial use and may not be used for any purpose other than to identify prospective properties the viewer may be interested in purchasing. All listing data, including but not limited to square footage and lot size is believed to be accurate, but the listing Agent, listing Broker and CRMLS and its affiliates do not warrant or guarantee such accuracy. The viewer should independently verify the listed data prior to making any decisions based on such information by personal inspection and/or contacting a real estate professional.
Based on information from California Regional Multiple Listing Service, Inc. and /or other sources. All data, including all measurements and calculations of area, is obtained from various sources and has not been, and will not be, verified by broker or MLS. All information should be independently reviewed and verified for accuracy. Properties may or may not be listed by the office/agent presenting the information