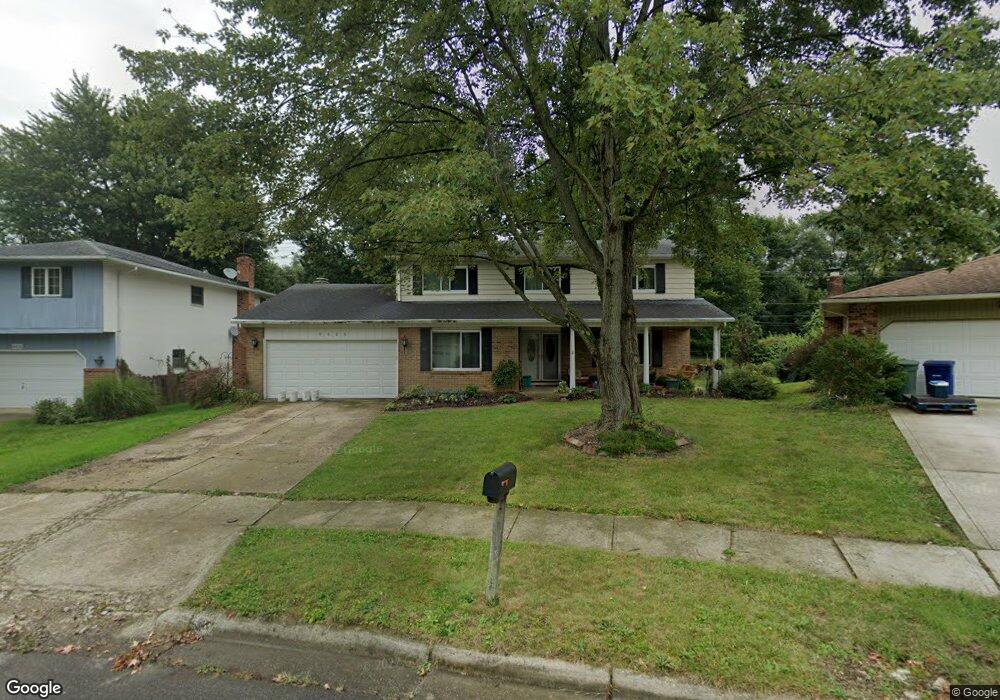
6626 Walbridge St Columbus, OH 43229
Northgate NeighborhoodEstimated Value: $349,000 - $413,000
5
Beds
3
Baths
2,332
Sq Ft
$160/Sq Ft
Est. Value
About This Home
This home is located at 6626 Walbridge St, Columbus, OH 43229 and is currently estimated at $373,375, approximately $160 per square foot. 6626 Walbridge St is a home located in Franklin County with nearby schools including Northgate Intermediate, Alpine Elementary School, and Woodward Park Middle School.
Ownership History
Date
Name
Owned For
Owner Type
Purchase Details
Closed on
Dec 7, 2015
Sold by
Kneice Carl L
Bought by
Kneice Carl L and Kneice Jacqueline Sue
Current Estimated Value
Purchase Details
Closed on
Dec 3, 2015
Sold by
Gillenwater Lisa D
Bought by
Kneice Carl L
Purchase Details
Closed on
Dec 1, 2015
Sold by
Logan William B and Estate Of Jeffrey A Kneice
Bought by
Kneice Carl L
Purchase Details
Closed on
Dec 14, 2014
Sold by
Kneice Gregory R
Bought by
Kneice Carl L
Purchase Details
Closed on
Jul 29, 2004
Sold by
Kneice Russell and Kneice Anna M
Bought by
Kneice Russell and Kneice Anna M
Purchase Details
Closed on
Jun 12, 1973
Bought by
Kneice Russell
Create a Home Valuation Report for This Property
The Home Valuation Report is an in-depth analysis detailing your home's value as well as a comparison with similar homes in the area
Home Values in the Area
Average Home Value in this Area
Purchase History
| Date | Buyer | Sale Price | Title Company |
|---|---|---|---|
| Kneice Carl L | -- | None Available | |
| Kneice Carl L | -- | None Available | |
| Kneice Carl L | $10,000 | None Available | |
| Kneice Carl L | -- | None Available | |
| Kneice Russell | -- | -- | |
| Kneice Russell | -- | -- |
Source: Public Records
Tax History Compared to Growth
Tax History
| Year | Tax Paid | Tax Assessment Tax Assessment Total Assessment is a certain percentage of the fair market value that is determined by local assessors to be the total taxable value of land and additions on the property. | Land | Improvement |
|---|---|---|---|---|
| 2024 | $4,689 | $104,480 | $21,880 | $82,600 |
| 2023 | $4,629 | $104,475 | $21,875 | $82,600 |
| 2022 | $3,814 | $73,540 | $14,420 | $59,120 |
| 2021 | $3,821 | $73,540 | $14,420 | $59,120 |
| 2020 | $3,826 | $73,540 | $14,420 | $59,120 |
| 2019 | $3,574 | $58,910 | $11,550 | $47,360 |
| 2018 | $3,369 | $58,910 | $11,550 | $47,360 |
| 2017 | $3,572 | $58,910 | $11,550 | $47,360 |
| 2016 | $3,494 | $52,750 | $11,690 | $41,060 |
| 2015 | $3,172 | $52,750 | $11,690 | $41,060 |
| 2014 | $3,271 | $52,750 | $11,690 | $41,060 |
| 2013 | $1,391 | $55,545 | $12,320 | $43,225 |
Source: Public Records
Map
Nearby Homes
- 6658 Walbridge St
- 2120 Willowick Dr Unit B
- 1947 Rockdale Dr Unit 33
- 6448 Sharon Woods Blvd Unit B
- 6496 Hearthstone Ave
- 6355 Johnanne St
- 2197 Bayfield Dr
- 6407 Skywae Dr
- 6245 Sharon Woods Blvd
- 2292 Laurelwood Dr Unit 2292L
- 1635 Tendril Ct
- 6048 Pinemoor St
- 6458 Faircrest Rd
- 6342 Bellmeadow Dr
- 2721 Woodland Trail Dr Unit 2721
- 465 W Schrock Rd
- 2623 Blendon Woods Blvd
- 2727 Patrick Ave
- 6407 Faircrest Rd
- 2250 Webster Canyon Ct
- 6630 Walbridge St
- 2141 Nobleshire Rd
- 6636 Walbridge St
- 2135 Nobleshire Rd
- 2128 Nobleshire Rd
- 6637 Walbridge St
- 6646 Walbridge St
- 2127 Nobleshire Rd
- 2135 Brookhurst Ave
- 6645 Walbridge St
- 2120 Nobleshire Rd
- 2133 Brookhurst Ave
- 2121 Nobleshire Rd
- 2131 Brookhurst Ave Unit 42C
- 2131 Brookhurst Ave Unit C
- 6657 Walbridge St
- 6636 Heather Ln
- 2129 Brookhurst Ave
- 2129 Brookhurst Ave Unit D
- 6646 Heather Ln