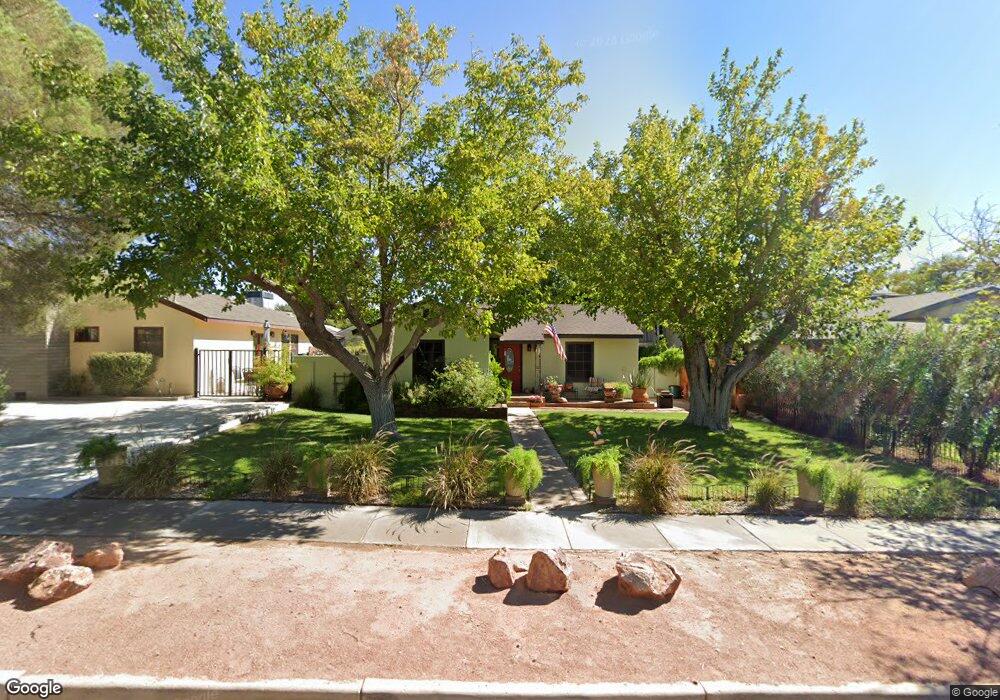
663 Avenue I Boulder City, NV 89005
Estimated Value: $351,702 - $380,000
2
Beds
1
Bath
936
Sq Ft
$394/Sq Ft
Est. Value
About This Home
This home is located at 663 Avenue I, Boulder City, NV 89005 and is currently estimated at $368,676, approximately $393 per square foot. 663 Avenue I is a home located in Clark County with nearby schools including Andrew Mitchell Elementary School, Martha P. King Elementary School, and Elton M. & Madelaine E. Garrett Junior High School.
Ownership History
Date
Name
Owned For
Owner Type
Purchase Details
Closed on
Apr 25, 2007
Sold by
Dickinson Sara
Bought by
Gloege Erik W
Current Estimated Value
Home Financials for this Owner
Home Financials are based on the most recent Mortgage that was taken out on this home.
Original Mortgage
$204,300
Interest Rate
6.66%
Mortgage Type
Unknown
Purchase Details
Closed on
May 22, 2004
Sold by
Mooney Denzil Cee and Mooney Lori
Bought by
Dickinson Sara
Home Financials for this Owner
Home Financials are based on the most recent Mortgage that was taken out on this home.
Original Mortgage
$168,000
Interest Rate
6.09%
Mortgage Type
Unknown
Purchase Details
Closed on
Apr 20, 1994
Sold by
Anderson Earl F and Anderson Mary Ellen
Bought by
Mooney Denzil and Mooney Lori
Home Financials for this Owner
Home Financials are based on the most recent Mortgage that was taken out on this home.
Original Mortgage
$105,927
Interest Rate
8.83%
Mortgage Type
VA
Create a Home Valuation Report for This Property
The Home Valuation Report is an in-depth analysis detailing your home's value as well as a comparison with similar homes in the area
Home Values in the Area
Average Home Value in this Area
Purchase History
| Date | Buyer | Sale Price | Title Company |
|---|---|---|---|
| Gloege Erik W | $227,000 | Chicago Title | |
| Dickinson Sara | $210,000 | United Title Of Nevada | |
| Mooney Denzil | $104,000 | United Title |
Source: Public Records
Mortgage History
| Date | Status | Borrower | Loan Amount |
|---|---|---|---|
| Previous Owner | Gloege Erik W | $204,300 | |
| Previous Owner | Dickinson Sara | $168,000 | |
| Previous Owner | Mooney Denzil | $105,927 |
Source: Public Records
Tax History Compared to Growth
Tax History
| Year | Tax Paid | Tax Assessment Tax Assessment Total Assessment is a certain percentage of the fair market value that is determined by local assessors to be the total taxable value of land and additions on the property. | Land | Improvement |
|---|---|---|---|---|
| 2025 | $806 | $62,986 | $49,000 | $13,986 |
| 2024 | $783 | $62,986 | $49,000 | $13,986 |
| 2023 | $783 | $49,375 | $36,750 | $12,625 |
| 2022 | $760 | $44,526 | $33,250 | $11,276 |
| 2021 | $738 | $40,927 | $30,450 | $10,477 |
| 2020 | $716 | $38,893 | $28,700 | $10,193 |
| 2019 | $695 | $36,076 | $26,250 | $9,826 |
| 2018 | $675 | $31,989 | $22,750 | $9,239 |
| 2017 | $788 | $30,160 | $21,000 | $9,160 |
| 2016 | $639 | $24,603 | $15,750 | $8,853 |
| 2015 | $638 | $24,330 | $15,750 | $8,580 |
| 2014 | $627 | $24,194 | $15,750 | $8,444 |
Source: Public Records
Map
Nearby Homes