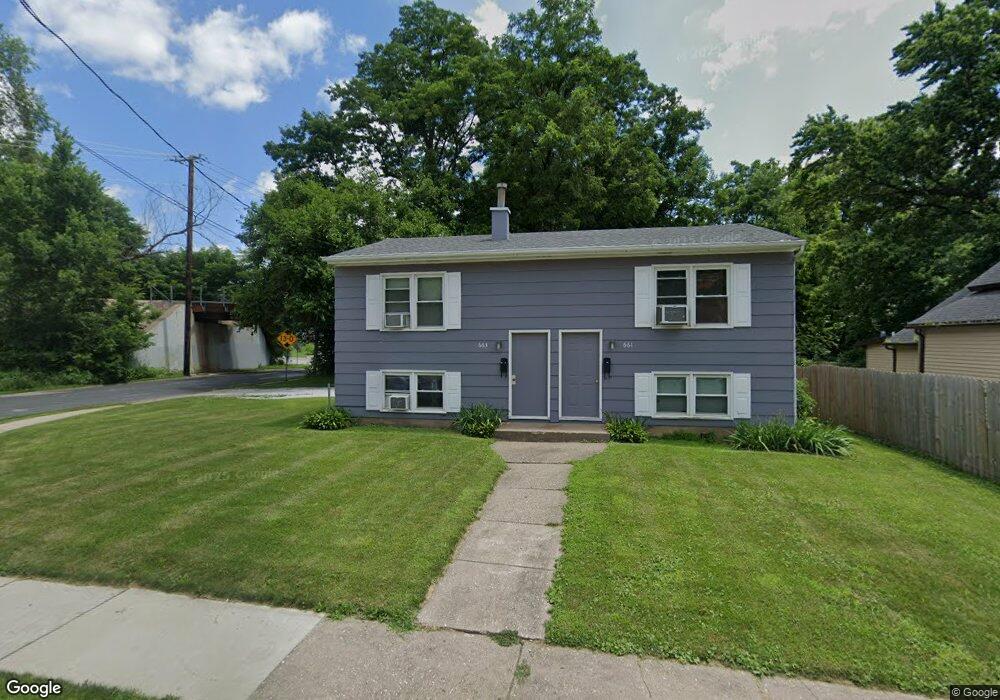
663 Cedar St Davenport, IA 52802
Fejervary NeighborhoodEstimated Value: $78,000 - $115,000
4
Beds
2
Baths
864
Sq Ft
$113/Sq Ft
Est. Value
About This Home
This home is located at 663 Cedar St, Davenport, IA 52802 and is currently estimated at $97,855, approximately $113 per square foot. 663 Cedar St is a home located in Scott County with nearby schools including Walnut Hill Elementary School, South Christian Elementary School, and Wilson Elementary School.
Ownership History
Date
Name
Owned For
Owner Type
Purchase Details
Closed on
Jan 3, 2025
Sold by
Trust Agreement Created By Daniel N Mays and Mays Daniel N
Bought by
Mays Daniel Neil and Mays Cyndia J
Current Estimated Value
Home Financials for this Owner
Home Financials are based on the most recent Mortgage that was taken out on this home.
Original Mortgage
$91,000
Interest Rate
6.6%
Mortgage Type
New Conventional
Purchase Details
Closed on
Nov 27, 2024
Sold by
Mays Daniel Neil and Mays Cyndia J
Bought by
Peeters Frank J and Peeters Penny K
Home Financials for this Owner
Home Financials are based on the most recent Mortgage that was taken out on this home.
Original Mortgage
$91,000
Interest Rate
6.6%
Mortgage Type
New Conventional
Purchase Details
Closed on
Oct 18, 2013
Sold by
Mays Daniel N and Mays Darleen J
Bought by
Carr William
Create a Home Valuation Report for This Property
The Home Valuation Report is an in-depth analysis detailing your home's value as well as a comparison with similar homes in the area
Home Values in the Area
Average Home Value in this Area
Purchase History
| Date | Buyer | Sale Price | Title Company |
|---|---|---|---|
| Mays Daniel Neil | -- | None Listed On Document | |
| Peeters Frank J | $85,000 | None Listed On Document | |
| Carr William | $10,000 | None Available |
Source: Public Records
Mortgage History
| Date | Status | Borrower | Loan Amount |
|---|---|---|---|
| Previous Owner | Peeters Frank J | $91,000 |
Source: Public Records
Tax History Compared to Growth
Tax History
| Year | Tax Paid | Tax Assessment Tax Assessment Total Assessment is a certain percentage of the fair market value that is determined by local assessors to be the total taxable value of land and additions on the property. | Land | Improvement |
|---|---|---|---|---|
| 2025 | $1,406 | $89,890 | $11,050 | $78,840 |
| 2024 | $1,924 | $78,630 | $11,050 | $67,580 |
| 2023 | $1,446 | $78,630 | $11,050 | $67,580 |
| 2022 | $1,553 | $67,700 | $11,050 | $56,650 |
| 2021 | $1,304 | $60,800 | $11,050 | $49,750 |
| 2020 | $1,296 | $59,690 | $11,050 | $48,640 |
| 2019 | $1,469 | $55,270 | $11,050 | $44,220 |
| 2018 | $1,214 | $55,270 | $11,050 | $44,220 |
| 2017 | $307 | $55,270 | $11,050 | $44,220 |
| 2016 | $1,551 | $55,270 | $0 | $0 |
| 2015 | $1,210 | $56,190 | $0 | $0 |
| 2014 | $1,248 | $56,190 | $0 | $0 |
| 2013 | $1,226 | $0 | $0 | $0 |
| 2012 | -- | $55,970 | $9,090 | $46,880 |
Source: Public Records
Map
Nearby Homes