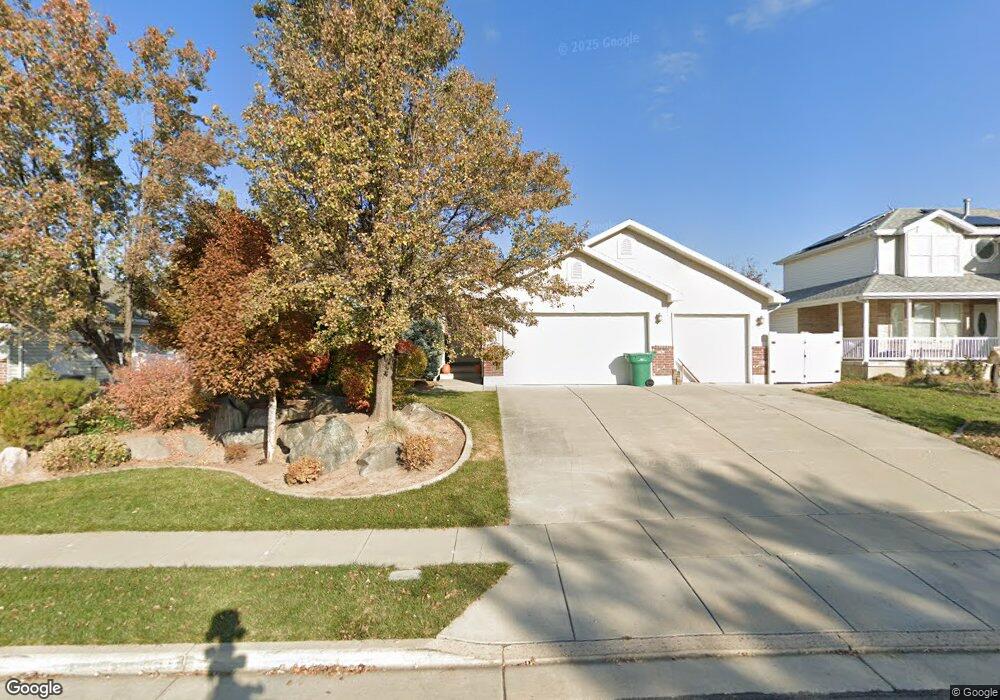
663 E 2050 S Clearfield, UT 84015
Estimated Value: $478,000 - $565,000
3
Beds
2
Baths
2,867
Sq Ft
$184/Sq Ft
Est. Value
About This Home
This home is located at 663 E 2050 S, Clearfield, UT 84015 and is currently estimated at $528,019, approximately $184 per square foot. 663 E 2050 S is a home located in Davis County with nearby schools including Antelope Elementary School, North Davis Junior High School, and Clearfield High School.
Ownership History
Date
Name
Owned For
Owner Type
Purchase Details
Closed on
Oct 12, 2023
Sold by
Timpke Jeffrey S
Bought by
Timpke Michelle
Current Estimated Value
Home Financials for this Owner
Home Financials are based on the most recent Mortgage that was taken out on this home.
Original Mortgage
$235,060
Outstanding Balance
$230,277
Interest Rate
7.18%
Mortgage Type
New Conventional
Estimated Equity
$297,742
Purchase Details
Closed on
Oct 13, 2004
Sold by
Phoenix Homes Inc
Bought by
Johnson Janet Sue
Home Financials for this Owner
Home Financials are based on the most recent Mortgage that was taken out on this home.
Original Mortgage
$81,600
Interest Rate
5.72%
Mortgage Type
Purchase Money Mortgage
Purchase Details
Closed on
Mar 3, 2004
Sold by
Coxey Construction & Remodeling Inc
Bought by
Phoenix Homes Inc
Create a Home Valuation Report for This Property
The Home Valuation Report is an in-depth analysis detailing your home's value as well as a comparison with similar homes in the area
Home Values in the Area
Average Home Value in this Area
Purchase History
| Date | Buyer | Sale Price | Title Company |
|---|---|---|---|
| Timpke Michelle | -- | Pinnacle Title | |
| Johnson Janet Sue | -- | Bonneville Title Company Inc | |
| Phoenix Homes Inc | -- | Title West Title Company |
Source: Public Records
Mortgage History
| Date | Status | Borrower | Loan Amount |
|---|---|---|---|
| Open | Timpke Michelle | $235,060 | |
| Previous Owner | Johnson Janet Sue | $81,600 |
Source: Public Records
Tax History
| Year | Tax Paid | Tax Assessment Tax Assessment Total Assessment is a certain percentage of the fair market value that is determined by local assessors to be the total taxable value of land and additions on the property. | Land | Improvement |
|---|---|---|---|---|
| 2025 | $3,185 | $285,450 | $72,093 | $213,357 |
| 2024 | $3,077 | $277,750 | $68,925 | $208,825 |
| 2023 | $2,831 | $469,000 | $110,323 | $358,677 |
| 2022 | $3,081 | $276,100 | $63,209 | $212,891 |
| 2021 | $2,748 | $372,000 | $67,057 | $304,943 |
| 2020 | $2,387 | $321,000 | $56,367 | $264,633 |
| 2019 | $2,305 | $306,000 | $59,172 | $246,828 |
| 2018 | $2,158 | $279,000 | $52,521 | $226,479 |
| 2016 | $1,835 | $124,080 | $20,970 | $103,110 |
| 2015 | $1,783 | $114,950 | $20,970 | $93,980 |
| 2014 | $1,721 | $112,398 | $20,970 | $91,428 |
| 2013 | -- | $98,289 | $29,480 | $68,809 |
Source: Public Records
Map
Nearby Homes
- 668 E 2000 S
- 2127 S 350 E
- 1477 N 2375 W
- 308 E 1925 S
- 2057 S James Cir
- 460 E 1700 S Unit 1 & 2
- 1430 N 2100 W
- 1250 N 2925 W
- 195 E 2325 S
- 1916 N Celia Way
- 1445 N 2925 W
- 154 E 2325 S
- 1141 N 2275 W
- 1491 N 1875 W
- 1491 N 1875 W Unit 158
- 1740 N Gregory Dr
- 1487 N 1875 W
- 1487 N 1875 W Unit 159
- 1483 N 1875 W
- 1479 N 1875 W
Your Personal Tour Guide
Ask me questions while you tour the home.