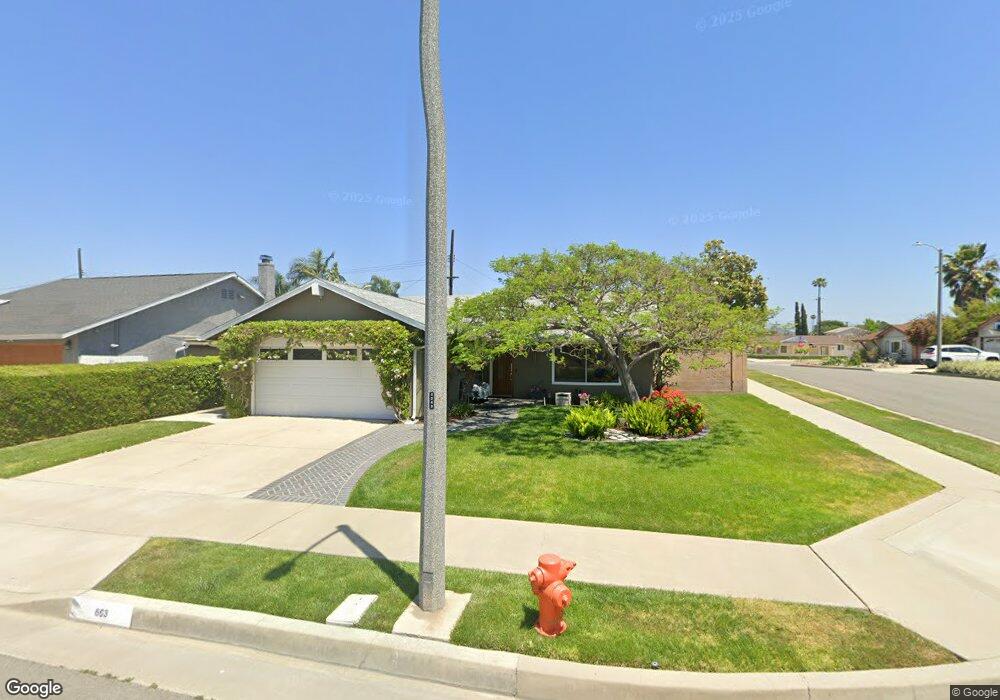
663 N Markwood St Orange, CA 92867
Estimated Value: $1,000,714 - $1,196,000
3
Beds
2
Baths
1,574
Sq Ft
$705/Sq Ft
Est. Value
About This Home
This home is located at 663 N Markwood St, Orange, CA 92867 and is currently estimated at $1,110,429, approximately $705 per square foot. 663 N Markwood St is a home located in Orange County with nearby schools including Handy Elementary School, Yorba Middle School, and Orange High School.
Ownership History
Date
Name
Owned For
Owner Type
Purchase Details
Closed on
Aug 22, 2018
Sold by
Martin Eleanor A
Bought by
Martin Eleanor A and The Eleanor A Martin 2018 Revocable Trus
Current Estimated Value
Create a Home Valuation Report for This Property
The Home Valuation Report is an in-depth analysis detailing your home's value as well as a comparison with similar homes in the area
Home Values in the Area
Average Home Value in this Area
Purchase History
| Date | Buyer | Sale Price | Title Company |
|---|---|---|---|
| Martin Eleanor A | -- | None Available |
Source: Public Records
Tax History Compared to Growth
Tax History
| Year | Tax Paid | Tax Assessment Tax Assessment Total Assessment is a certain percentage of the fair market value that is determined by local assessors to be the total taxable value of land and additions on the property. | Land | Improvement |
|---|---|---|---|---|
| 2025 | $3,205 | $278,472 | $118,696 | $159,776 |
| 2024 | $3,205 | $273,012 | $116,368 | $156,644 |
| 2023 | $3,130 | $267,659 | $114,086 | $153,573 |
| 2022 | $3,066 | $262,411 | $111,849 | $150,562 |
| 2021 | $2,289 | $191,046 | $109,656 | $81,390 |
| 2020 | $2,267 | $189,088 | $108,532 | $80,556 |
| 2019 | $2,240 | $185,381 | $106,404 | $78,977 |
| 2018 | $2,205 | $181,747 | $104,318 | $77,429 |
| 2017 | $2,119 | $178,184 | $102,273 | $75,911 |
| 2016 | $2,079 | $174,691 | $100,268 | $74,423 |
| 2015 | $2,047 | $172,067 | $98,761 | $73,306 |
| 2014 | $2,002 | $168,697 | $96,826 | $71,871 |
Source: Public Records
Map
Nearby Homes
- 641 N Milford St
- 2515 E Orange Grove Ave
- 790 N Fern St
- 811 N Handy St
- 2705 E Orange Grove Ave
- 415 N Wayfield St
- 1801 E Collins Ave Unit 42
- 1801 E Collins Ave Unit 65
- 1801 E Collins Ave Unit 6
- 2929 E Hamilton Ave
- 201 E Collins Ave Unit 134
- 692 N Adele St Unit 30
- 692 N Adele St Unit 109
- 692 N Adele St Unit 78
- 234 N Milford St
- 3145 E Scotts View Unit A
- 1316 E Lomita Ave
- 2331 E Adams Ave
- 316 N Shattuck Place
- 1241 E Mayfair Ave
- 673 N Markwood St
- 658 N Milford St
- 658 N Milford Rd
- 668 N Milford St
- 641 N Markwood St
- 679 N Markwood St
- 678 N Milford St
- 670 N Markwood St
- 642 N Milford St
- 656 N Markwood St
- 676 N Markwood St
- 646 N Markwood St
- 631 N Markwood St
- 688 N Milford St
- 634 N Milford St
- 681 N Markwood St
- 691 N Markwood St
- 2225 E Hamilton Ave
- 665 N Sacramento St
- 655 N Sacramento St