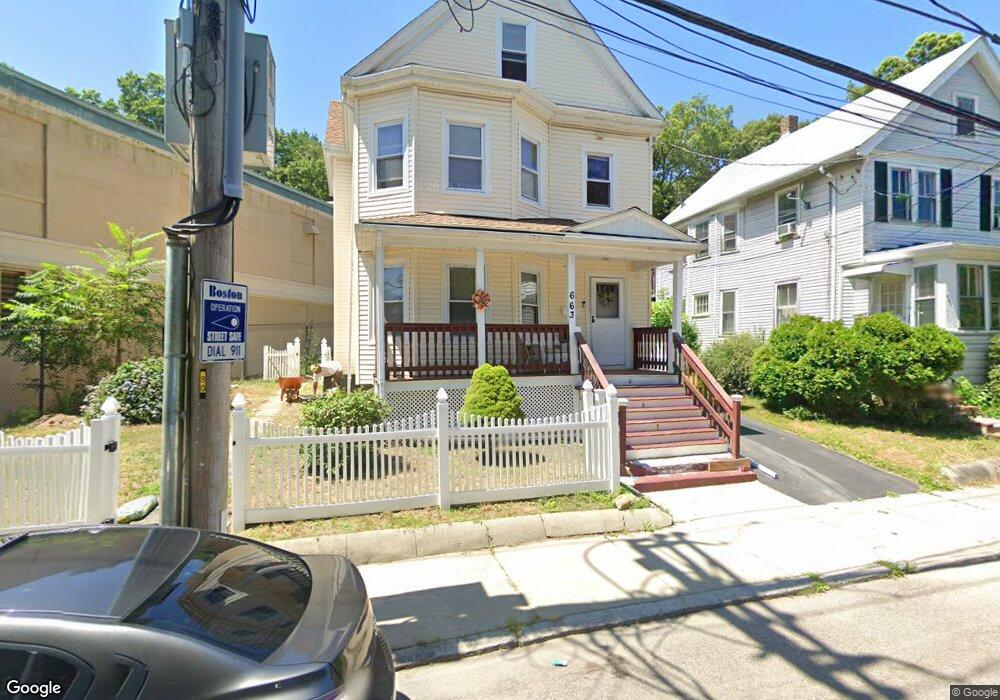
663 South St Roslindale, MA 02131
Roslindale NeighborhoodEstimated Value: $643,000 - $871,000
3
Beds
1
Bath
1,522
Sq Ft
$510/Sq Ft
Est. Value
About This Home
This home is located at 663 South St, Roslindale, MA 02131 and is currently estimated at $775,821, approximately $509 per square foot. 663 South St is a home located in Suffolk County with nearby schools including Brooke Charter School Roslindale, The Croft School - Jamaica Plain, and Sacred Heart STEM School.
Ownership History
Date
Name
Owned For
Owner Type
Purchase Details
Closed on
Mar 9, 2022
Sold by
Cadogan Akeem M and Reid Ralph J
Bought by
Cadogan-Reid Paulette L
Current Estimated Value
Purchase Details
Closed on
Jan 20, 2021
Sold by
Ccadagan Reid P
Bought by
Ccadagan Akeem M
Purchase Details
Closed on
Jul 9, 2009
Sold by
Reid Ralph J
Bought by
Reid Paulette L and Reid Ralph J
Purchase Details
Closed on
Jul 2, 2008
Sold by
Reid Paulette C
Bought by
Reid Ralph
Purchase Details
Closed on
Jul 31, 1996
Sold by
Condon William J and Condon Claire M
Bought by
Cadogan Paulette L
Home Financials for this Owner
Home Financials are based on the most recent Mortgage that was taken out on this home.
Original Mortgage
$71,250
Interest Rate
8.27%
Mortgage Type
Purchase Money Mortgage
Create a Home Valuation Report for This Property
The Home Valuation Report is an in-depth analysis detailing your home's value as well as a comparison with similar homes in the area
Home Values in the Area
Average Home Value in this Area
Purchase History
| Date | Buyer | Sale Price | Title Company |
|---|---|---|---|
| Cadogan-Reid Paulette L | -- | None Available | |
| Ccadagan Akeem M | -- | None Available | |
| Reid Paulette L | -- | -- | |
| Reid Ralph | -- | -- | |
| Cadogan Paulette L | $95,000 | -- |
Source: Public Records
Mortgage History
| Date | Status | Borrower | Loan Amount |
|---|---|---|---|
| Previous Owner | Cadogan Paulette L | $117,000 | |
| Previous Owner | Cadogan Paulette L | $71,250 | |
| Closed | Cadogan Paulette L | $19,000 |
Source: Public Records
Tax History Compared to Growth
Tax History
| Year | Tax Paid | Tax Assessment Tax Assessment Total Assessment is a certain percentage of the fair market value that is determined by local assessors to be the total taxable value of land and additions on the property. | Land | Improvement |
|---|---|---|---|---|
| 2025 | $8,086 | $698,300 | $243,200 | $455,100 |
| 2024 | $6,990 | $641,300 | $220,800 | $420,500 |
| 2023 | $6,888 | $641,300 | $220,800 | $420,500 |
| 2022 | $6,230 | $572,600 | $197,100 | $375,500 |
| 2021 | $5,935 | $556,200 | $197,100 | $359,100 |
| 2020 | $5,273 | $499,300 | $182,300 | $317,000 |
| 2019 | $4,874 | $462,400 | $154,300 | $308,100 |
| 2018 | $4,489 | $428,300 | $154,300 | $274,000 |
| 2017 | $4,536 | $428,300 | $154,300 | $274,000 |
| 2016 | $4,574 | $415,800 | $154,300 | $261,500 |
| 2015 | $4,263 | $352,000 | $133,100 | $218,900 |
| 2014 | $4,026 | $320,000 | $133,100 | $186,900 |
Source: Public Records
Map
Nearby Homes
- 108 Florence St Unit 3
- 108 Florence St Unit 1
- 108 Florence St Unit 4
- 620 South St
- 4031 Washington St
- 187 Florence St Unit 2L
- 67 Cummins Hwy Unit 101
- 15 S Fairview St Unit 3
- 4012 Washington St
- 19 Delford St
- 19 Delford St Unit 1
- 173 Brookway Rd
- 65 Birch St Unit 3
- 79 Robert St Unit 3
- 348-350 Hyde Park Ave Unit 2
- 103 Belgrade Ave Unit 2
- 2 Weld Hill St Unit PH2
- 27 Rowe St
- 80 Roslindale Ave Unit 3
- 18-20 Northbourne Rd Unit 18
- 661 South St
- 661 South St Unit 661
- 661 South St Unit 1
- 4139 Washington St
- 656 South St
- 655 South St Unit 657
- 654 South St
- 654 South St Unit 1
- 15 Lee Hill Rd
- 11 Lee Hill Rd
- 653 South St Unit 2
- 653 South St Unit 1
- 19 Lee Hill Rd
- 7 Lee Hill Rd
- 4121 Washington St
- 4121 Washington St Unit 2
- 652 South St
- 652 South St Unit 2
- 652 South St Unit 1
- 651 South St