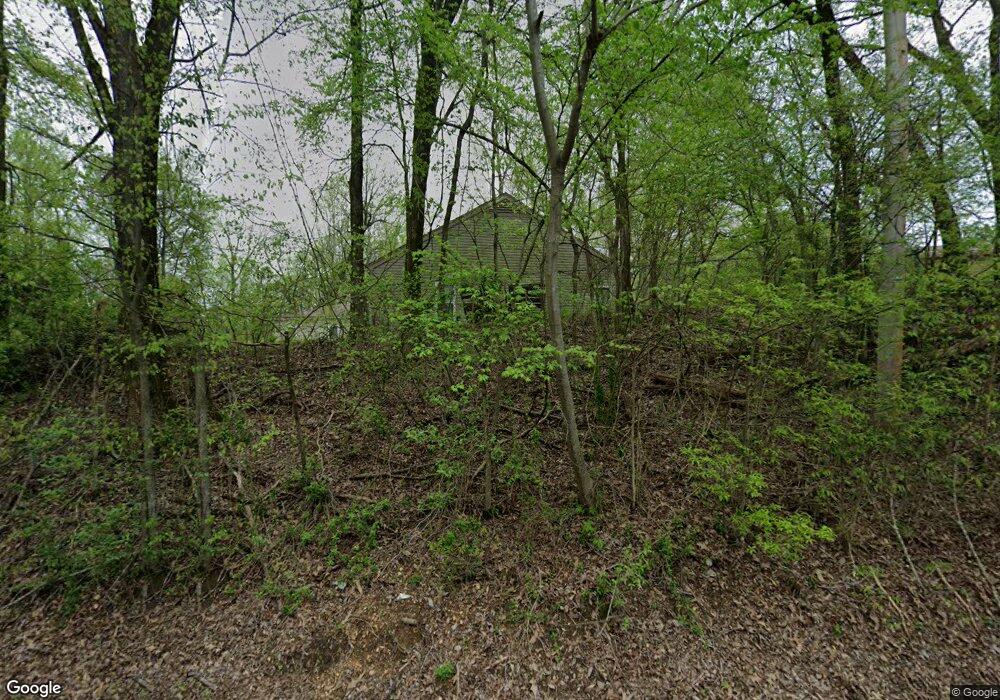
6630 Walsh Rd Millington, TN 38053
Estimated Value: $254,000 - $365,000
3
Beds
3
Baths
2,114
Sq Ft
$140/Sq Ft
Est. Value
About This Home
This home is located at 6630 Walsh Rd, Millington, TN 38053 and is currently estimated at $296,412, approximately $140 per square foot. 6630 Walsh Rd is a home located in Shelby County with nearby schools including E.E. Jeter Elementary School and Trezevant High School.
Ownership History
Date
Name
Owned For
Owner Type
Purchase Details
Closed on
Jul 6, 2022
Sold by
Perkins Jason Lynn
Bought by
Perkins Christy Tate
Current Estimated Value
Purchase Details
Closed on
Jan 20, 2008
Sold by
Perkins Tammie Marie
Bought by
Perkins Jason Lynn
Purchase Details
Closed on
Nov 30, 2000
Sold by
Negelein Melvin and Negelein Sherry C
Bought by
Perkins Jason L and Perkins Tammie M
Home Financials for this Owner
Home Financials are based on the most recent Mortgage that was taken out on this home.
Original Mortgage
$125,436
Interest Rate
7.71%
Mortgage Type
FHA
Purchase Details
Closed on
Jul 18, 2000
Sold by
Estate Of Michael Bryan Maclin
Bought by
Negelein Melvin and Negelein Sherry C
Home Financials for this Owner
Home Financials are based on the most recent Mortgage that was taken out on this home.
Original Mortgage
$65,000
Interest Rate
8.3%
Mortgage Type
Construction
Create a Home Valuation Report for This Property
The Home Valuation Report is an in-depth analysis detailing your home's value as well as a comparison with similar homes in the area
Home Values in the Area
Average Home Value in this Area
Purchase History
| Date | Buyer | Sale Price | Title Company |
|---|---|---|---|
| Perkins Christy Tate | -- | None Listed On Document | |
| Perkins Jason Lynn | -- | None Available | |
| Perkins Jason L | $125,500 | -- | |
| Negelein Melvin | $45,000 | -- |
Source: Public Records
Mortgage History
| Date | Status | Borrower | Loan Amount |
|---|---|---|---|
| Previous Owner | Perkins Jason L | $125,436 | |
| Previous Owner | Negelein Melvin | $65,000 |
Source: Public Records
Tax History Compared to Growth
Tax History
| Year | Tax Paid | Tax Assessment Tax Assessment Total Assessment is a certain percentage of the fair market value that is determined by local assessors to be the total taxable value of land and additions on the property. | Land | Improvement |
|---|---|---|---|---|
| 2025 | $1,680 | $68,625 | $13,425 | $55,200 |
| 2024 | $1,680 | $49,550 | $11,775 | $37,775 |
| 2023 | $1,680 | $49,550 | $11,775 | $37,775 |
| 2022 | $1,680 | $49,550 | $11,775 | $37,775 |
| 2021 | $1,709 | $49,550 | $11,775 | $37,775 |
| 2020 | $1,448 | $35,750 | $10,725 | $25,025 |
| 2019 | $1,448 | $35,750 | $10,725 | $25,025 |
| 2018 | $1,448 | $35,750 | $10,725 | $25,025 |
| 2017 | $1,469 | $35,750 | $10,725 | $25,025 |
| 2016 | $1,670 | $38,225 | $0 | $0 |
| 2014 | $1,373 | $31,425 | $0 | $0 |
Source: Public Records
Map
Nearby Homes
- 1 Walsh Rd
- 6770 Camp John Rd
- 0 N Watkins Unit 10203950
- 0 N Watkins Unit 10193620
- 6525 N Watkins Rd
- 1435 Walsh Cove
- 1907 Campbell Rd
- 6234 Woodstock Cuba Rd
- 7441 Walsh Rd
- 7550 Woodstock Cuba Rd
- 7265 Ward Rd
- 2714 Moonview Rd
- 6007 Island Forty Rd
- 6224 Benjestown Rd
- 6621 Benjestown Rd
- 7790 Deer Lake Dr
- 5921 Benjestown Rd
- 5907 Old Millington Rd
- 3073 Jericho Rd
- 2078 Russell Bond Rd
- 6610 Walsh Rd
- 1341 Walsh Rd Unit TRACT 1
- 6590 Walsh Rd
- 6585 Walsh Rd
- 6650 Walsh Rd
- 6559 Walsh Rd
- 6577 Walsh Rd
- 6540 Walsh Rd
- 6690 Walsh Rd
- 6545 Walsh Rd
- 6550 Walsh Rd
- 6525 Walsh Rd
- 1769 Little John Rd
- 6520 Walsh Rd
- 6505 Walsh Rd
- 6710 Walsh Rd
- 6727 Walsh Rd
- 6480 Walsh Rd
- 1825 Little John Rd
- 1689 Sylvanshire Cove