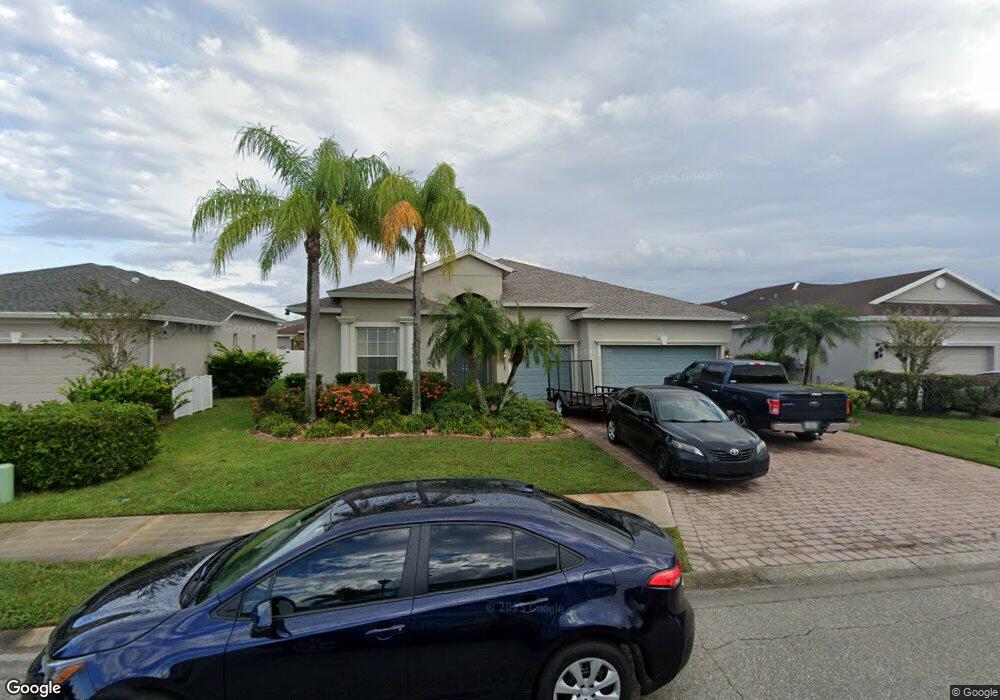
6631 38th St E Sarasota, FL 34243
Estimated Value: $539,772 - $649,000
4
Beds
3
Baths
2,667
Sq Ft
$216/Sq Ft
Est. Value
About This Home
This home is located at 6631 38th St E, Sarasota, FL 34243 and is currently estimated at $575,693, approximately $215 per square foot. 6631 38th St E is a home located in Manatee County with nearby schools including Kinnan Elementary School, Braden River Middle School, and Southeast High School.
Ownership History
Date
Name
Owned For
Owner Type
Purchase Details
Closed on
Jul 20, 2017
Sold by
Greenly Caroline F
Bought by
Fordham Lori R and Fordham Keyroy
Current Estimated Value
Home Financials for this Owner
Home Financials are based on the most recent Mortgage that was taken out on this home.
Original Mortgage
$336,775
Outstanding Balance
$280,340
Interest Rate
3.96%
Estimated Equity
$295,353
Purchase Details
Closed on
Feb 22, 2012
Sold by
Greenly Kevin F
Bought by
Greenly Caroline F
Purchase Details
Closed on
Apr 13, 2009
Sold by
Levitt & Sons Of Manatee County Llc
Bought by
Greenly Caroline and Greenly Kevin
Home Financials for this Owner
Home Financials are based on the most recent Mortgage that was taken out on this home.
Original Mortgage
$220,794
Interest Rate
5.18%
Mortgage Type
FHA
Create a Home Valuation Report for This Property
The Home Valuation Report is an in-depth analysis detailing your home's value as well as a comparison with similar homes in the area
Home Values in the Area
Average Home Value in this Area
Purchase History
| Date | Buyer | Sale Price | Title Company |
|---|---|---|---|
| Fordham Lori R | $354,500 | -- | |
| Greenly Caroline F | -- | None Available | |
| Greenly Caroline | $224,900 | First American Title Ins Co |
Source: Public Records
Mortgage History
| Date | Status | Borrower | Loan Amount |
|---|---|---|---|
| Open | Fordham Lori R | $336,775 | |
| Closed | Fordham Lori R | -- | |
| Previous Owner | Greenly Caroline | $220,794 |
Source: Public Records
Tax History
| Year | Tax Paid | Tax Assessment Tax Assessment Total Assessment is a certain percentage of the fair market value that is determined by local assessors to be the total taxable value of land and additions on the property. | Land | Improvement |
|---|---|---|---|---|
| 2025 | $6,957 | $439,298 | -- | -- |
| 2023 | $6,802 | $520,379 | $45,900 | $474,479 |
| 2022 | $6,122 | $453,527 | $45,000 | $408,527 |
| 2021 | $4,802 | $300,046 | $40,000 | $260,046 |
| 2020 | $4,697 | $279,443 | $40,000 | $239,443 |
| 2019 | $5,031 | $298,427 | $40,000 | $258,427 |
| 2018 | $4,947 | $290,251 | $40,000 | $250,251 |
| 2017 | $2,371 | $176,270 | $0 | $0 |
| 2016 | $2,354 | $172,644 | $0 | $0 |
Source: Public Records
Map
Nearby Homes
- 6627 38th Ln E
- 6659 38th Ln E
- 6682 41st Street Cir E
- 4054 65th Place E
- 3835 Autumn Fern Terrace
- 4078 65th Place E
- 6619 35th Ct E
- 6636 35th Ct E
- 4108 65th Place E
- 3558 65th Avenue Cir E
- 6964 White Willow Ct
- 6506 42nd St E
- 6502 42nd St E
- 3549 65th Avenue Cir E
- 3540 65th Avenue Cir E
- 3538 65th Avenue Cir E
- 3541 65th Avenue Cir E
- 6514 41st Ct E
- 6343 Laurel Wood Run
- 6507 41st Ct E
- 6635 38th St E
- 6627 38th St E
- 3811 67th Terrace E
- 6623 38th St E Unit E
- 6623 38th St E
- 6654 38th Ln E
- 6630 E St
- 6650 38th Ln E
- 6630 38th St E
- 6626 38th St E
- 6634 38th St E
- 3802 67th Terrace E
- 6619 38th St E
- 6622 38th St E
- 6646 38th Ln E
- 6618 38th St E
- 3810 67th Terrace E
- 3718 67th Terrace E
- 6615 38th St E
Your Personal Tour Guide
Ask me questions while you tour the home.