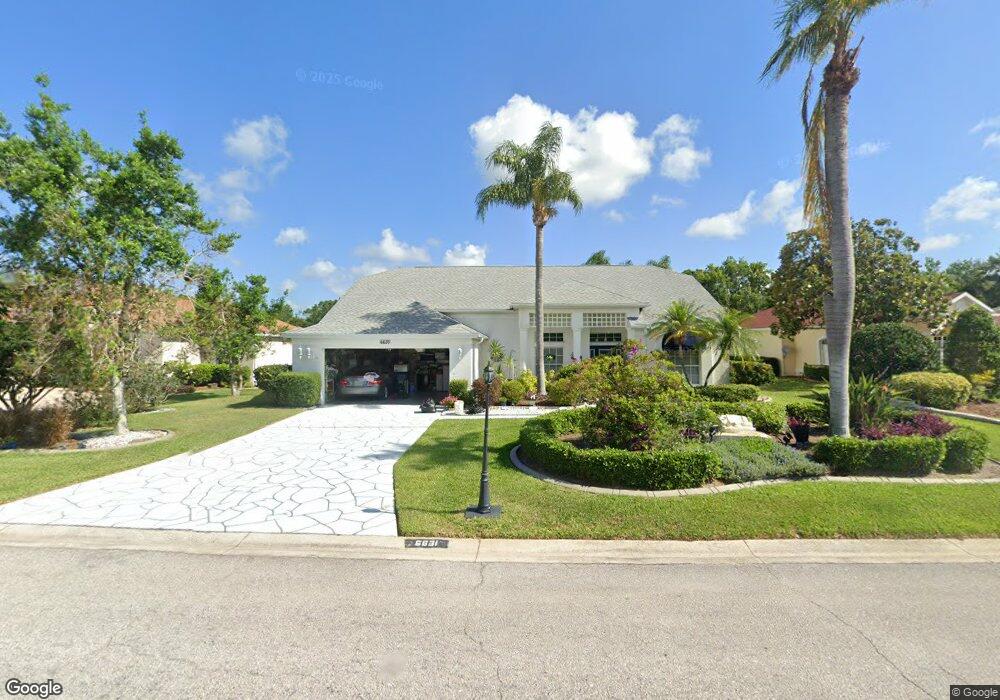
6631 Peach Tree Creek Rd Bradenton, FL 34203
Braden River NeighborhoodEstimated Value: $479,277 - $598,000
3
Beds
3
Baths
1,828
Sq Ft
$287/Sq Ft
Est. Value
About This Home
This home is located at 6631 Peach Tree Creek Rd, Bradenton, FL 34203 and is currently estimated at $523,819, approximately $286 per square foot. 6631 Peach Tree Creek Rd is a home located in Manatee County with nearby schools including Tara Elementary School, Braden River Middle School, and Braden River High School.
Ownership History
Date
Name
Owned For
Owner Type
Purchase Details
Closed on
May 24, 2010
Sold by
Devries Lamae J and Sprik Lamae J
Bought by
Webster Jeffrey T and Webster Carol D
Current Estimated Value
Home Financials for this Owner
Home Financials are based on the most recent Mortgage that was taken out on this home.
Original Mortgage
$222,010
Outstanding Balance
$150,255
Interest Rate
5.25%
Mortgage Type
FHA
Estimated Equity
$373,564
Purchase Details
Closed on
May 4, 2006
Sold by
Sprik Harlan and Sprik Lamae
Bought by
Sprik Harlan J and Sprik Lamae J
Purchase Details
Closed on
Nov 18, 2002
Sold by
Baldwin Mary L
Bought by
Sprik Harlan and Sprik Lamae
Purchase Details
Closed on
Dec 7, 1995
Sold by
Breckinridge Const Inc
Bought by
Baldwin Arthur E and Baldwin Mary L
Home Financials for this Owner
Home Financials are based on the most recent Mortgage that was taken out on this home.
Original Mortgage
$140,700
Interest Rate
7.4%
Create a Home Valuation Report for This Property
The Home Valuation Report is an in-depth analysis detailing your home's value as well as a comparison with similar homes in the area
Home Values in the Area
Average Home Value in this Area
Purchase History
| Date | Buyer | Sale Price | Title Company |
|---|---|---|---|
| Webster Jeffrey T | $225,000 | A Clear Title & Escrow Excha | |
| Sprik Harlan J | -- | Attorney | |
| Sprik Harlan | $255,000 | -- | |
| Baldwin Arthur E | $175,900 | -- |
Source: Public Records
Mortgage History
| Date | Status | Borrower | Loan Amount |
|---|---|---|---|
| Open | Webster Jeffrey T | $222,010 | |
| Previous Owner | Baldwin Arthur E | $140,700 |
Source: Public Records
Tax History Compared to Growth
Tax History
| Year | Tax Paid | Tax Assessment Tax Assessment Total Assessment is a certain percentage of the fair market value that is determined by local assessors to be the total taxable value of land and additions on the property. | Land | Improvement |
|---|---|---|---|---|
| 2025 | $2,934 | $238,210 | -- | -- |
| 2024 | $2,934 | $231,497 | -- | -- |
| 2023 | $2,893 | $224,754 | $0 | $0 |
| 2022 | $2,557 | $201,782 | $0 | $0 |
| 2021 | $2,455 | $195,905 | $0 | $0 |
| 2020 | $2,536 | $193,200 | $0 | $0 |
| 2019 | $2,498 | $188,856 | $0 | $0 |
| 2018 | $2,477 | $185,335 | $0 | $0 |
| 2017 | $2,302 | $181,523 | $0 | $0 |
| 2016 | $2,298 | $177,789 | $0 | $0 |
| 2015 | $2,328 | $176,553 | $0 | $0 |
| 2014 | $2,328 | $175,152 | $0 | $0 |
| 2013 | $2,319 | $172,564 | $49,350 | $123,214 |
Source: Public Records
Map
Nearby Homes
- 6901 Chickasaw Bayou Rd
- 6643 Butlers Crest Dr
- 6637 Pleasant Hill Rd
- 6644 Butlers Crest Dr
- 6904 Drewrys Bluff Unit 810
- 6904 Drewrys Bluff Unit 803
- 6908 Drewrys Bluff Unit 704
- 6908 Drewrys Bluff Unit 711
- 6338 Stone River Rd
- 6803 Drewrys Bluff
- 5712 Cottonwood St Unit 1703
- 6423 Drewrys Bluff
- 5811 White Oak Bayou Ct
- 6507 Drewrys Bluff
- 7157 Strand Cir Unit 24-102
- 6155 Aviary Ct
- 7161 Drewrys Bluff
- 6409 Stone River Rd
- 6103 Aviary Ct
- 6907 Stoneywalk Ct Unit V24
- 6627 Peach Tree Creek Rd
- 6705 Peach Tree Creek Rd
- 6623 Peach Tree Creek Rd
- 6709 Peach Tree Creek Rd
- 6626 Peach Tree Creek Rd
- 6622 Peach Tree Creek Rd
- 6619 Peach Tree Creek Rd
- 6713 Peach Tree Creek Rd
- 6730 Peach Tree Creek Rd
- 6615 Peach Tree Creek Rd
- 6717 Peach Tree Creek Rd
- 6734 Peach Tree Creek Rd
- 6614 Peach Tree Creek Rd
- 6611 Peach Tree Creek Rd
- 6738 Peach Tree Creek Rd
- 6721 Peach Tree Creek Rd
- 6610 Peach Tree Creek Rd
- 6607 Peach Tree Creek Rd
- 6725 Peach Tree Creek Rd
- 6803 Brookhaven Place