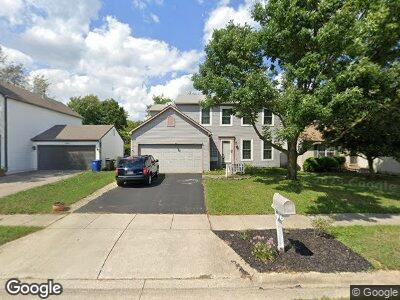
6634 Cloverlawn Cir Canal Winchester, OH 43110
East Columbus-White Ash NeighborhoodEstimated Value: $295,000 - $320,000
4
Beds
2
Baths
1,464
Sq Ft
$207/Sq Ft
Est. Value
About This Home
This home is located at 6634 Cloverlawn Cir, Canal Winchester, OH 43110 and is currently estimated at $303,524, approximately $207 per square foot. 6634 Cloverlawn Cir is a home located in Franklin County with nearby schools including Winchester Trail Elementary School, Indian Trail Elementary School, and Canal Winchester Middle School.
Ownership History
Date
Name
Owned For
Owner Type
Purchase Details
Closed on
Nov 21, 2000
Sold by
Green Tree Financial Servicing Corp
Bought by
Beveridge Nicole J
Current Estimated Value
Home Financials for this Owner
Home Financials are based on the most recent Mortgage that was taken out on this home.
Original Mortgage
$124,936
Interest Rate
7.8%
Mortgage Type
FHA
Purchase Details
Closed on
Feb 22, 2000
Sold by
Lane Dwayne T and Lane Julia L
Bought by
Conseco Finance Servicing Corp and Green Tree Financial Servicing Corp
Purchase Details
Closed on
Nov 19, 1996
Sold by
Borror Corp
Bought by
Lane Wayne T and Lane Julia L
Home Financials for this Owner
Home Financials are based on the most recent Mortgage that was taken out on this home.
Original Mortgage
$122,100
Interest Rate
8.18%
Mortgage Type
Balloon
Purchase Details
Closed on
Jul 30, 1996
Sold by
Borror Realty Co
Bought by
Borror Corp
Create a Home Valuation Report for This Property
The Home Valuation Report is an in-depth analysis detailing your home's value as well as a comparison with similar homes in the area
Home Values in the Area
Average Home Value in this Area
Purchase History
| Date | Buyer | Sale Price | Title Company |
|---|---|---|---|
| Beveridge Nicole J | $125,000 | -- | |
| Conseco Finance Servicing Corp | -- | -- | |
| Lane Wayne T | $135,675 | -- | |
| Borror Corp | $21,816 | -- |
Source: Public Records
Mortgage History
| Date | Status | Borrower | Loan Amount |
|---|---|---|---|
| Open | Beveridge Nicole J | $123,019 | |
| Closed | Beveridge Nicole J | $123,243 | |
| Closed | Beveridge Nicole J | $124,936 | |
| Previous Owner | Lane Wayne T | $122,100 |
Source: Public Records
Tax History Compared to Growth
Tax History
| Year | Tax Paid | Tax Assessment Tax Assessment Total Assessment is a certain percentage of the fair market value that is determined by local assessors to be the total taxable value of land and additions on the property. | Land | Improvement |
|---|---|---|---|---|
| 2024 | $4,294 | $88,910 | $23,280 | $65,630 |
| 2023 | $4,268 | $88,910 | $23,280 | $65,630 |
| 2022 | $3,056 | $56,070 | $12,040 | $44,030 |
| 2021 | $3,091 | $56,070 | $12,040 | $44,030 |
| 2020 | $3,079 | $56,070 | $12,040 | $44,030 |
| 2019 | $2,834 | $44,280 | $9,630 | $34,650 |
| 2018 | $2,887 | $44,280 | $9,630 | $34,650 |
| 2017 | $2,852 | $44,280 | $9,630 | $34,650 |
| 2016 | $3,001 | $44,770 | $7,810 | $36,960 |
| 2015 | $3,011 | $44,770 | $7,810 | $36,960 |
| 2014 | $3,010 | $44,770 | $7,810 | $36,960 |
| 2013 | $1,572 | $47,145 | $8,225 | $38,920 |
Source: Public Records
Map
Nearby Homes
- 6786 Warriner Way
- 5694 Danmar Dr
- 6802 Kristins Cove Ln
- 5682 Levi Kramer Blvd
- 5680 Winchester Pike
- 6963 Weurful Dr
- 5443 John Browning Ct
- 6999 Winchester Crossing Blvd
- 6682 Lagrange Dr Unit 48B
- 5176 Lodi Dr Unit 26B
- 6983 Remsen Dr Unit 77A
- 7011 Selva Trail Dr
- 5210 Novelty Ave Unit 73D
- 5846 Canal Bridge Dr
- 6709 Axtel Dr Unit 5A
- 5536 Winchester Meadows Dr
- 5569 Harvest Curve Ln
- 6730 Axtel Dr
- 6706 Axtel Dr Unit 7A
- 630 W Waterloo St
- 6634 Cloverlawn Cir
- 6640 Cloverlawn Cir
- 6628 Cloverlawn Cir
- 6646 Cloverlawn Cir
- 6622 Cloverlawn Cir
- 6603 Warriner Way
- 6609 Warriner Way
- 6597 Warriner Way
- 6615 Warriner Way
- 6616 Cloverlawn Cir
- 6652 Cloverlawn Cir
- 6589 Warriner Way
- 6631 Cloverlawn Cir
- 6621 Warriner Way
- 6625 Cloverlawn Cir
- 6637 Cloverlawn Cir
- 6658 Cloverlawn Cir
- 6608 Cloverlawn Cir
- 6643 Cloverlawn Cir
- 6619 Cloverlawn Cir