Estimated Value: $749,773 - $849,000
4
Beds
2
Baths
1,827
Sq Ft
$440/Sq Ft
Est. Value
About This Home
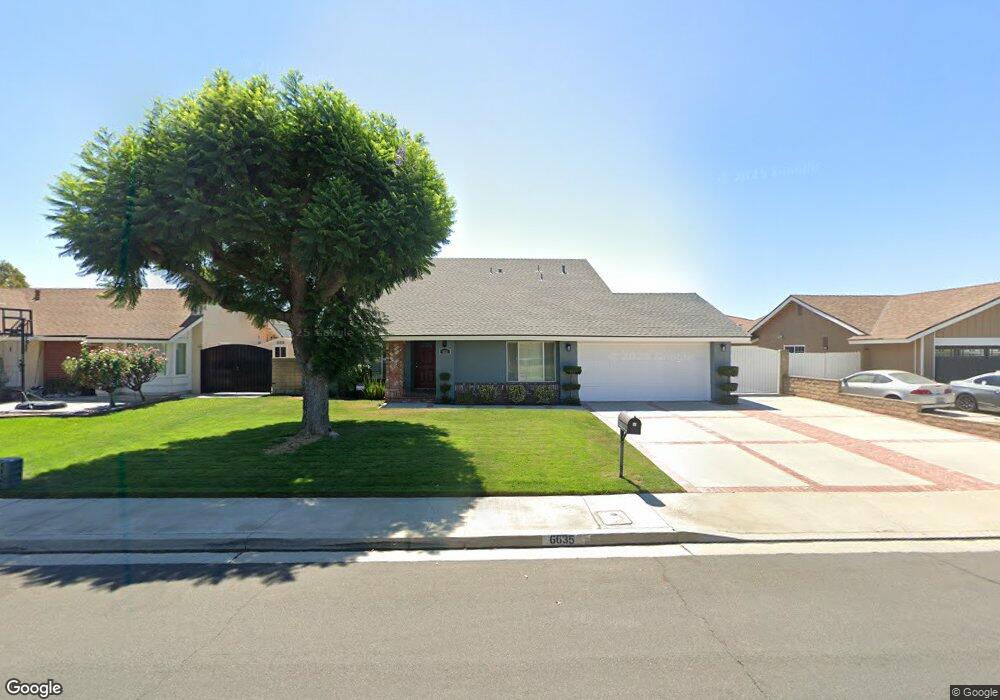
This home is located at 6635 Arthur St, Chino, CA 91710 and is currently estimated at $804,693, approximately $440 per square foot. 6635 Arthur St is a home located in San Bernardino County with nearby schools including Alicia Cortez Elementary, Magnolia Junior High, and Chino High School.
Ownership History
Date
Name
Owned For
Owner Type
Purchase Details
Closed on
Feb 10, 2023
Sold by
Sanchez Alan A
Bought by
Alan Andrews Sanchez Living Trust
Current Estimated Value
Purchase Details
Closed on
Jul 20, 2010
Sold by
Gulickson Grant Given and Gulickson Debra Kay
Bought by
Sanchez Alan A
Home Financials for this Owner
Home Financials are based on the most recent Mortgage that was taken out on this home.
Original Mortgage
$272,000
Interest Rate
4.65%
Mortgage Type
New Conventional
Purchase Details
Closed on
Oct 3, 2006
Sold by
Gulickson Grant Given and Gulickson Debra Kay
Bought by
Gulickson Grant Given and Gulickson Debra Kay
Purchase Details
Closed on
Nov 4, 2005
Sold by
Gulickson Grant Given and Gulickson Debra Kay
Bought by
Gulickson Grant Given and Gulickson Debra Kay
Home Financials for this Owner
Home Financials are based on the most recent Mortgage that was taken out on this home.
Original Mortgage
$50,000
Interest Rate
6.31%
Mortgage Type
New Conventional
Purchase Details
Closed on
Jun 23, 2003
Sold by
Gulickson Grant Given and Gulickson Debra Kay
Bought by
Gulickson Grant Given and Gulickson Debra Kay
Home Financials for this Owner
Home Financials are based on the most recent Mortgage that was taken out on this home.
Original Mortgage
$121,200
Interest Rate
5.26%
Mortgage Type
Purchase Money Mortgage
Purchase Details
Closed on
Oct 3, 2002
Sold by
Gulickson Grant Given and Gulickson Debra Kay
Bought by
Gulickson Grant Given and Gulickson Debra Kay
Home Financials for this Owner
Home Financials are based on the most recent Mortgage that was taken out on this home.
Original Mortgage
$122,000
Interest Rate
6.05%
Purchase Details
Closed on
Mar 18, 1999
Sold by
Kay Gulickson Grant G and Kay Debra
Bought by
Gulickson Grant Given and Gulickson Debra Kay
Home Financials for this Owner
Home Financials are based on the most recent Mortgage that was taken out on this home.
Original Mortgage
$114,000
Interest Rate
6.76%
Purchase Details
Closed on
Feb 26, 1999
Sold by
Kay Gulickson Grant G and Kay Debra
Bought by
Gulickson Grant Given and Gulickson Debra Kay
Home Financials for this Owner
Home Financials are based on the most recent Mortgage that was taken out on this home.
Original Mortgage
$114,000
Interest Rate
6.76%
Purchase Details
Closed on
Mar 8, 1996
Sold by
Gulickson Grant Given and Gulickson Debra Kay
Bought by
Gulickson Grant Given and Gulickson Debra Kay
Create a Home Valuation Report for This Property
The Home Valuation Report is an in-depth analysis detailing your home's value as well as a comparison with similar homes in the area
Home Values in the Area
Average Home Value in this Area
Purchase History
| Date | Buyer | Sale Price | Title Company |
|---|---|---|---|
| Alan Andrews Sanchez Living Trust | -- | -- | |
| Sanchez Alan A | $340,000 | Fidelity National Title Co | |
| Gulickson Grant Given | -- | None Available | |
| Gulickson Grant Given | -- | None Available | |
| Gulickson Grant Given | -- | American Title Inc | |
| Gulickson Grant Given | -- | -- | |
| Gulickson Grant Given | -- | -- | |
| Gulickson Grant Given | -- | Chicago Title Co | |
| Gulickson Grant Given | -- | Chicago Title Co | |
| Gulickson Grant Given | -- | Southland Title Company | |
| Gulickson Grant Given | -- | Southland Title Corporation | |
| Gulickson Grant Given | -- | -- | |
| Gulickson Grant Given | -- | Commonwealth Land Title Co | |
| Gulickson Grant Given | -- | -- | |
| Gulickson Grant Given | -- | -- |
Source: Public Records
Mortgage History
| Date | Status | Borrower | Loan Amount |
|---|---|---|---|
| Previous Owner | Sanchez Alan A | $272,000 | |
| Previous Owner | Gulickson Grant Given | $50,000 | |
| Previous Owner | Gulickson Grant Given | $121,200 | |
| Previous Owner | Gulickson Grant Given | $122,000 | |
| Previous Owner | Gulickson Grant Given | $114,000 |
Source: Public Records
Tax History
| Year | Tax Paid | Tax Assessment Tax Assessment Total Assessment is a certain percentage of the fair market value that is determined by local assessors to be the total taxable value of land and additions on the property. | Land | Improvement |
|---|---|---|---|---|
| 2025 | $4,862 | $435,601 | $152,460 | $283,141 |
| 2024 | $4,733 | $427,060 | $149,471 | $277,589 |
| 2023 | $4,602 | $418,686 | $146,540 | $272,146 |
| 2022 | $4,575 | $410,477 | $143,667 | $266,810 |
| 2021 | $4,486 | $402,428 | $140,850 | $261,578 |
| 2020 | $4,428 | $398,302 | $139,406 | $258,896 |
| 2019 | $4,350 | $390,493 | $136,673 | $253,820 |
| 2018 | $4,254 | $382,836 | $133,993 | $248,843 |
| 2017 | $4,179 | $375,330 | $131,366 | $243,964 |
| 2016 | $3,905 | $367,970 | $128,790 | $239,180 |
| 2015 | $3,827 | $362,442 | $126,855 | $235,587 |
| 2014 | $3,751 | $355,342 | $124,370 | $230,972 |
Source: Public Records
Map
Nearby Homes
- 6766 Foxcroft Ct
- 6756 Summerfield Ct
- 12804 Somerset Place
- 12834 Zinnea Ave
- 12997 Falcon Place
- 12837 Sunrose Ct
- 12737 Carob Ct
- 6833 Renato Ct
- 13035 Arlington Ln
- 12476 Park Ave
- 12482 Silkleaf Ave
- 320 W Walnut St Unit 51
- 2819 S Euclid Ave
- 125 E Saint Andrews St
- 12400 Cypress Ave Unit 45
- 13290 San Antonio Ave
- 13284 Cypress Ave
- 6221 Garfield St
- 13266 Murano Ave Unit 19
- 14000 San Antonio Ave
- 6647 Arthur St
- 6623 Arthur St
- 6659 Arthur St
- 6611 Arthur St
- 12772 Orange Ave
- 6654 Mogano Dr
- 6658 Mogano Dr
- 6634 Mogano Dr
- 12797 Kumquat Ave
- 6662 Foxcroft Ct
- 6661 Arthur St
- 6609 Arthur St
- 6646 Mogano Dr
- 12775 Orange Ave
- 12760 Orange Ave
- 6650 Mogano Dr
- 6626 Mogano Dr
- 12785 Kumquat Ave
- 6666 Foxcroft Ct
- 6638 Mogano Dr
Your Personal Tour Guide
Ask me questions while you tour the home.