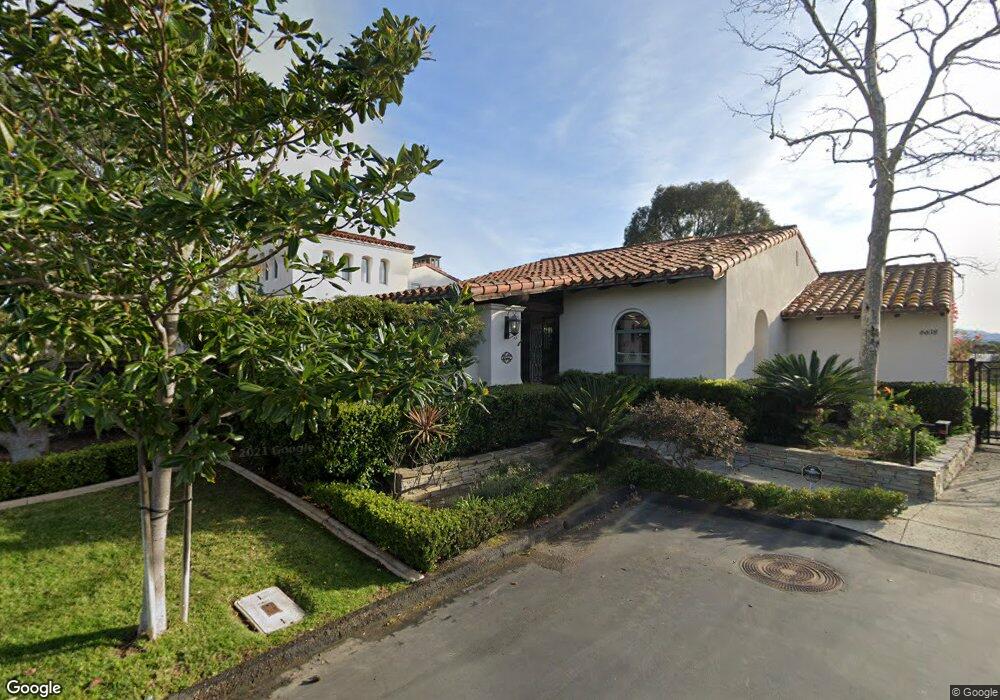
6638 Senecio Place Unit 2 San Diego, CA 92130
Carmel Valley NeighborhoodEstimated Value: $3,670,903 - $4,446,000
3
Beds
3
Baths
3,928
Sq Ft
$1,019/Sq Ft
Est. Value
About This Home
This home is located at 6638 Senecio Place Unit 2, San Diego, CA 92130 and is currently estimated at $4,002,726, approximately $1,019 per square foot. 6638 Senecio Place Unit 2 is a home located in San Diego County with nearby schools including Ashley Falls Elementary School, Pacific Trails Middle, and Torrey Pines High School.
Ownership History
Date
Name
Owned For
Owner Type
Purchase Details
Closed on
Oct 6, 2005
Sold by
Labelle Michael R and Labelle Eileen M
Bought by
Labelle Michael R and Labelle Eileen M
Current Estimated Value
Purchase Details
Closed on
Feb 6, 2004
Sold by
Labelle Michael Robert and Labelle Eileen
Bought by
Labelle Michael Robert and Labelle Eileen
Home Financials for this Owner
Home Financials are based on the most recent Mortgage that was taken out on this home.
Original Mortgage
$100,000
Interest Rate
5.85%
Mortgage Type
Credit Line Revolving
Purchase Details
Closed on
Oct 31, 2002
Sold by
Mesa Verde Del Mar Lp
Bought by
Labelle Michael R and Wadding Eileen M
Home Financials for this Owner
Home Financials are based on the most recent Mortgage that was taken out on this home.
Original Mortgage
$1,046,175
Interest Rate
4.62%
Create a Home Valuation Report for This Property
The Home Valuation Report is an in-depth analysis detailing your home's value as well as a comparison with similar homes in the area
Home Values in the Area
Average Home Value in this Area
Purchase History
| Date | Buyer | Sale Price | Title Company |
|---|---|---|---|
| Labelle Michael R | -- | -- | |
| Labelle Michael R | -- | -- | |
| Labelle Michael Robert | -- | Fidelity National Title Co | |
| Labelle Michael R | $1,395,000 | Commonwealth Land Title Co |
Source: Public Records
Mortgage History
| Date | Status | Borrower | Loan Amount |
|---|---|---|---|
| Closed | Labelle Michael Robert | $100,000 | |
| Previous Owner | Labelle Michael R | $1,046,175 |
Source: Public Records
Tax History Compared to Growth
Tax History
| Year | Tax Paid | Tax Assessment Tax Assessment Total Assessment is a certain percentage of the fair market value that is determined by local assessors to be the total taxable value of land and additions on the property. | Land | Improvement |
|---|---|---|---|---|
| 2025 | $22,949 | $2,020,268 | $977,620 | $1,042,648 |
| 2024 | $22,949 | $1,980,655 | $958,451 | $1,022,204 |
| 2023 | $22,483 | $1,941,819 | $939,658 | $1,002,161 |
| 2022 | $22,151 | $1,903,745 | $921,234 | $982,511 |
| 2021 | $21,400 | $1,866,418 | $903,171 | $963,247 |
| 2020 | $21,573 | $1,847,282 | $893,911 | $953,371 |
| 2019 | $21,183 | $1,811,062 | $876,384 | $934,678 |
| 2018 | $20,324 | $1,775,551 | $859,200 | $916,351 |
| 2017 | $19,974 | $1,740,737 | $842,353 | $898,384 |
| 2016 | $19,378 | $1,706,606 | $825,837 | $880,769 |
| 2015 | $19,113 | $1,680,973 | $813,433 | $867,540 |
| 2014 | $18,754 | $1,648,046 | $797,499 | $850,547 |
Source: Public Records
Map
Nearby Homes
- 6370 Carmel View S
- 6286 Belmont Trail Ct
- 6938 The Preserve Terrace
- 0 Grand Del Mar Place Unit VU 8-4-5 NDP2502279
- 13165 Caminito Mendiola
- 12348 Dormouse Rd
- 13233 Petunia Way
- 5398 Shannon Ridge Ln
- 13033 Lamia Point Unit 217
- 11265 Caminito Aclara
- 11324 Caminito Rodar
- 11318 Caminito Rodar
- 5621 Shasta Daisy Trail
- 11311 Caminito Rodar
- 11319 Caminito Rodar
- 10941 Derrydown Way Unit 10
- 13032 Alora Point Unit 170
- 7055 Chapala Canyon Ct
- 5255 Greenwillow Ln
- 12932 Peppergrass Creek Gate Unit 58
- 6626 Senecio Place Unit 2
- 6635 Senecio Place
- 6660 Mower Place
- 6644 Mower Place
- 6636 Mower Place
- 6623 Senecio Place Unit 2
- 6614 Senecio Place Unit 2
- 6628 Mower Place
- 6668 Mower Place Unit 2
- 6620 Mower Place
- 6609 Mower Place Unit 2
- 6676 Mower Place Unit 2
- 6655 Rancho Toyon Place
- 6612 Mower Place
- 6645 Rancho Toyon Place
- 6675 Rancho Toyon Place
- 6603 Mower Place
- 6604 Mower Place
- 6655 Duck Pond Ln
- 6647 Duck Pond Ln