6639 6639 84th Ct N Brooklyn Park, MN 55445
Candlewood NeighborhoodEstimated Value: $150,565 - $172,000
2
Beds
1
Bath
924
Sq Ft
$174/Sq Ft
Est. Value
About This Home
This home is located at 6639 6639 84th Ct N, Brooklyn Park, MN 55445 and is currently estimated at $161,141, approximately $174 per square foot. 6639 6639 84th Ct N is a home located in Hennepin County with nearby schools including Edinbrook Elementary School, North View Middle School, and Osseo Senior High School.
Ownership History
Date
Name
Owned For
Owner Type
Purchase Details
Closed on
Jun 28, 2024
Sold by
Anderson Kelsie Jo and Morgan Kelsie
Bought by
Hemming Jack and Hemming Patricia
Current Estimated Value
Purchase Details
Closed on
Sep 12, 2019
Sold by
Sundean Robert G
Bought by
Anderson Kelsie Jo
Home Financials for this Owner
Home Financials are based on the most recent Mortgage that was taken out on this home.
Original Mortgage
$111,381
Interest Rate
3.56%
Mortgage Type
New Conventional
Purchase Details
Closed on
Mar 29, 2006
Sold by
Fredine Brian D
Bought by
Sundean Robert G
Purchase Details
Closed on
Aug 8, 2002
Sold by
Conavatti Brandon J and Conavatti Stephanie M
Bought by
Fredine Brian D
Purchase Details
Closed on
Aug 30, 2000
Sold by
Larson Michael D and Larson Diana J
Bought by
Conavatti Brandon J and Cress Stephanie M
Create a Home Valuation Report for This Property
The Home Valuation Report is an in-depth analysis detailing your home's value as well as a comparison with similar homes in the area
Home Values in the Area
Average Home Value in this Area
Purchase History
| Date | Buyer | Sale Price | Title Company |
|---|---|---|---|
| Hemming Jack | $150,000 | Burnet Title | |
| Anderson Kelsie Jo | $132,000 | Watermark Title Agency | |
| Sundean Robert G | $119,900 | -- | |
| Fredine Brian D | $103,900 | -- | |
| Conavatti Brandon J | $71,600 | -- |
Source: Public Records
Mortgage History
| Date | Status | Borrower | Loan Amount |
|---|---|---|---|
| Previous Owner | Anderson Kelsie Jo | $111,381 | |
| Previous Owner | Anderson Kelsie Jo | $113,019 |
Source: Public Records
Tax History Compared to Growth
Tax History
| Year | Tax Paid | Tax Assessment Tax Assessment Total Assessment is a certain percentage of the fair market value that is determined by local assessors to be the total taxable value of land and additions on the property. | Land | Improvement |
|---|---|---|---|---|
| 2024 | $1,647 | $140,100 | $30,000 | $110,100 |
| 2023 | $2,072 | $147,500 | $30,000 | $117,500 |
| 2022 | $1,572 | $149,100 | $30,000 | $119,100 |
| 2021 | $1,706 | $132,700 | $20,000 | $112,700 |
| 2020 | $1,274 | $122,800 | $20,000 | $102,800 |
| 2019 | $1,006 | $108,400 | $20,000 | $88,400 |
| 2018 | $689 | $88,200 | $14,900 | $73,300 |
| 2017 | $709 | $63,700 | $14,900 | $48,800 |
| 2016 | $968 | $58,200 | $14,900 | $43,300 |
| 2015 | $618 | $53,000 | $14,900 | $38,100 |
| 2014 | -- | $45,000 | $14,900 | $30,100 |
Source: Public Records
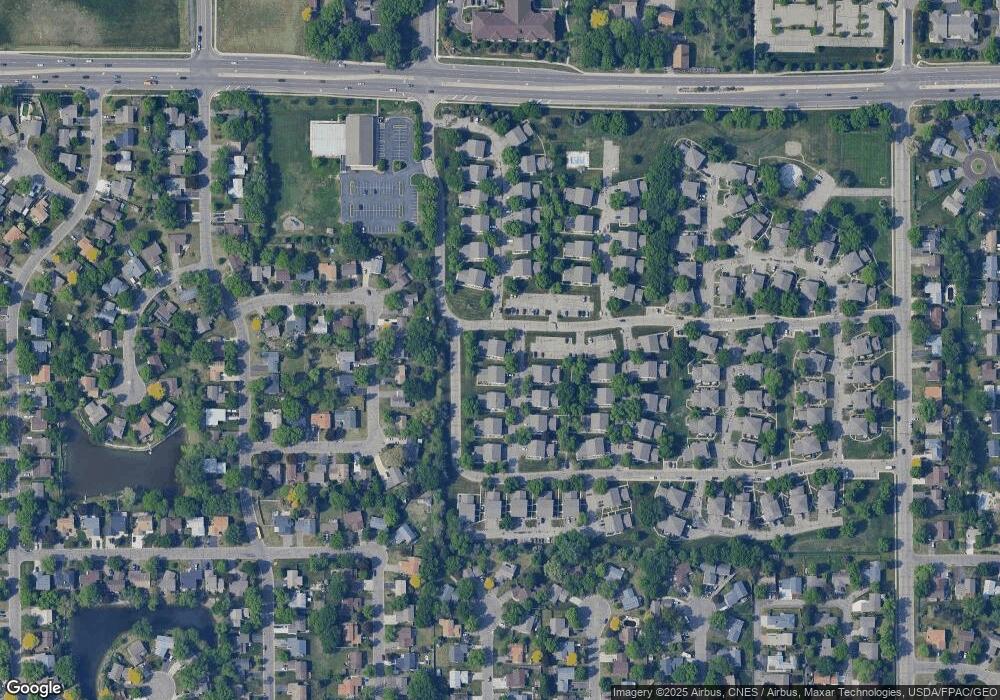
Map
Nearby Homes
- 6523 84th Ct N Unit 6523
- 6526 83rd Ct N
- 6614 84th Ct N
- 6517 83rd Ct N
- 6415 84th Ct N
- 8233 Hampshire Ct N
- 6716 83rd Ave N
- 8357 Jersey Ave N
- 8400 Brunswick Ave N
- 8614 Tessman Pkwy N
- 6236 Creekview Ln N
- 8657 Tessman Cir N
- 8033 Georgia Ave N
- 5932 83rd Pkwy N
- 6508 88th Ave N
- 8426 Yates Ave N
- 8576 S Maplebrook Cir
- 8526 S Maplebrook Cir
- 7224 79th Ave N
- 8439 Toledo Ave N
- 6641 84th Ct N
- 6639 84th Ct N
- 6637 84th Ct N
- 6635 84th Ct N
- 6633 84th Ct N
- 6631 84th Ct N Unit 663184
- 6629 84th Ct N
- 6627 84th Ct N Unit 66274
- 6631 84th Ct N
- 6627 84th Ct N
- 6633 84th Ct N
- 6607 84th Ct N Unit 6607
- 6605 84th Ct N Unit 6605
- 6603 84th Ct N
- 6601 84th Ct N
- 6625 84th Ct N
- 6623 84th Ct N
- 6621 84th Ct N
- 6619 84th Ct N
- 6625 84th Ct N