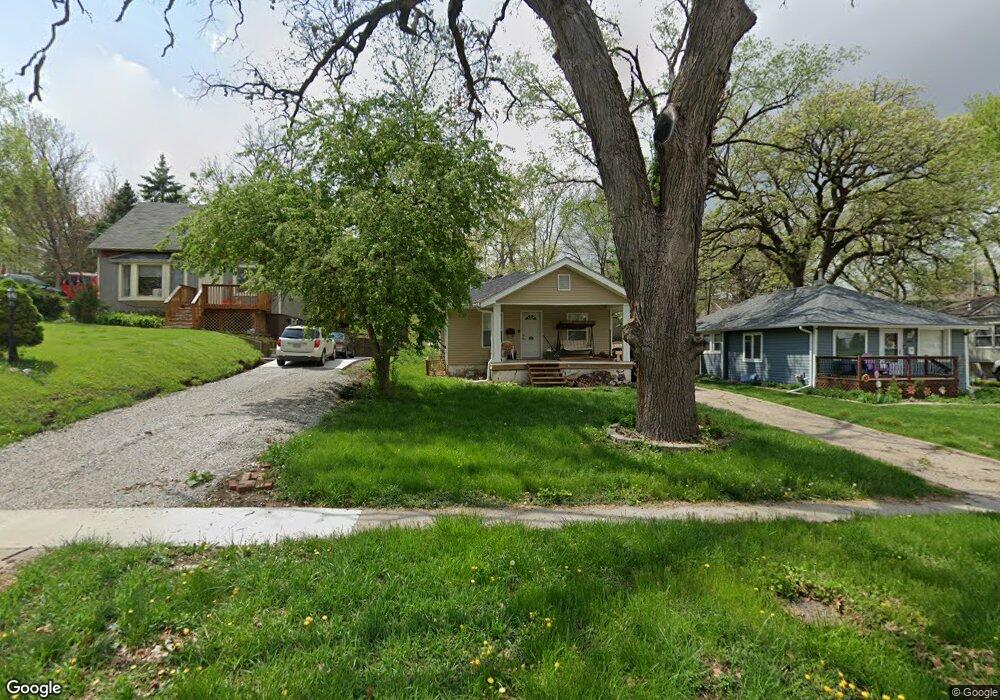
664 27th St Des Moines, IA 50312
Woodland Heights NeighborhoodEstimated Value: $158,124 - $192,000
2
Beds
1
Bath
891
Sq Ft
$194/Sq Ft
Est. Value
About This Home
This home is located at 664 27th St, Des Moines, IA 50312 and is currently estimated at $173,031, approximately $194 per square foot. 664 27th St is a home located in Polk County with nearby schools including Greenwood Elementary School, Roosevelt High School, and St Augustin Catholic School.
Ownership History
Date
Name
Owned For
Owner Type
Purchase Details
Closed on
Sep 15, 2008
Sold by
Shoe Investments Llc
Bought by
Nisly Aaron
Current Estimated Value
Home Financials for this Owner
Home Financials are based on the most recent Mortgage that was taken out on this home.
Original Mortgage
$93,301
Outstanding Balance
$62,147
Interest Rate
6.55%
Mortgage Type
FHA
Estimated Equity
$110,884
Purchase Details
Closed on
Oct 8, 2007
Sold by
Schumacher Adam L
Bought by
Shoe Investments Llc
Purchase Details
Closed on
Jul 27, 2007
Sold by
Canada Redell and Canada Pat
Bought by
Schumacher Adam
Purchase Details
Closed on
Sep 15, 2006
Sold by
Canada Patricia A and Canada Redell
Bought by
Smith David
Create a Home Valuation Report for This Property
The Home Valuation Report is an in-depth analysis detailing your home's value as well as a comparison with similar homes in the area
Home Values in the Area
Average Home Value in this Area
Purchase History
| Date | Buyer | Sale Price | Title Company |
|---|---|---|---|
| Nisly Aaron | $94,500 | None Available | |
| Shoe Investments Llc | -- | None Available | |
| Schumacher Adam | $36,500 | None Available | |
| Smith David | $29,302 | None Available |
Source: Public Records
Mortgage History
| Date | Status | Borrower | Loan Amount |
|---|---|---|---|
| Open | Nisly Aaron | $93,301 | |
| Closed | Smith David | $0 |
Source: Public Records
Tax History Compared to Growth
Tax History
| Year | Tax Paid | Tax Assessment Tax Assessment Total Assessment is a certain percentage of the fair market value that is determined by local assessors to be the total taxable value of land and additions on the property. | Land | Improvement |
|---|---|---|---|---|
| 2025 | $2,378 | $148,700 | $33,700 | $115,000 |
| 2024 | $2,378 | $131,300 | $29,700 | $101,600 |
| 2023 | $2,256 | $131,300 | $29,700 | $101,600 |
| 2022 | $2,316 | $104,600 | $24,200 | $80,400 |
| 2021 | $2,172 | $108,000 | $24,200 | $83,800 |
| 2020 | $2,250 | $95,600 | $21,600 | $74,000 |
| 2019 | $2,020 | $95,600 | $21,600 | $74,000 |
| 2018 | $1,994 | $83,700 | $18,800 | $64,900 |
| 2017 | $1,934 | $83,700 | $18,800 | $64,900 |
| 2016 | $1,878 | $80,000 | $17,800 | $62,200 |
| 2015 | $1,878 | $80,000 | $17,800 | $62,200 |
| 2014 | $1,826 | $77,400 | $16,900 | $60,500 |
Source: Public Records
Map
Nearby Homes