664 34th St Des Moines, IA 50312
North of Grand NeighborhoodEstimated Value: $223,000 - $259,000
3
Beds
1
Bath
1,341
Sq Ft
$178/Sq Ft
Est. Value
About This Home
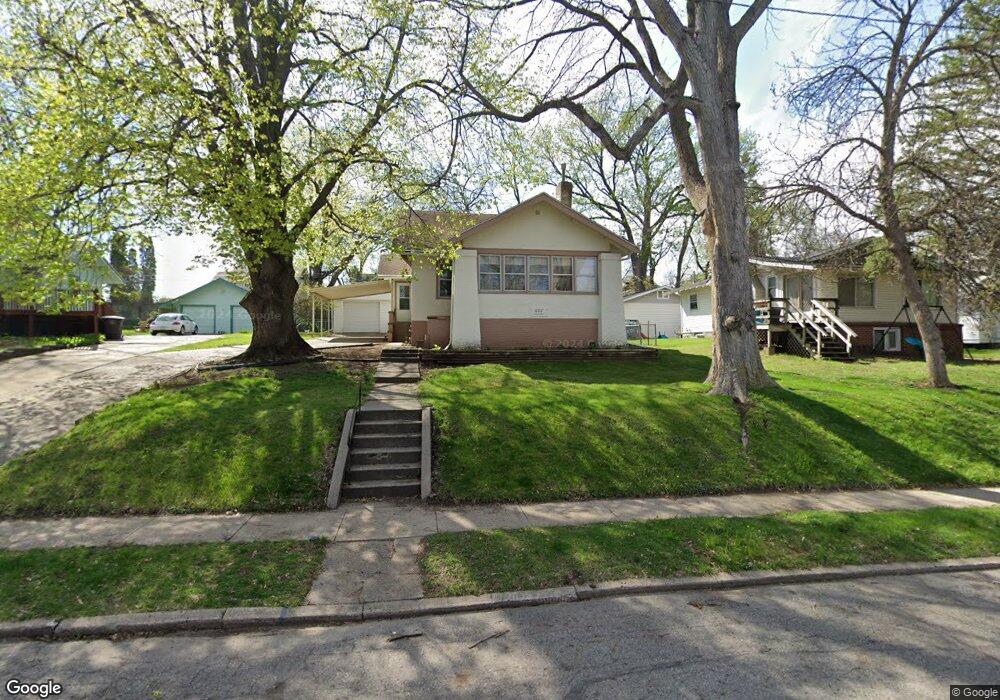
This home is located at 664 34th St, Des Moines, IA 50312 and is currently estimated at $238,783, approximately $178 per square foot. 664 34th St is a home located in Polk County with nearby schools including Greenwood Elementary School, Roosevelt High School, and St Augustin Catholic School.
Ownership History
Date
Name
Owned For
Owner Type
Purchase Details
Closed on
Dec 6, 2024
Sold by
Jj Real Estate Holdings Corp
Bought by
Cosonero Llc
Current Estimated Value
Purchase Details
Closed on
Aug 3, 2022
Sold by
Vander Wiel Jack W and Vander Elizabeth J
Bought by
Elizabeth J Vander Wiel Living Trust
Purchase Details
Closed on
Jul 25, 2002
Sold by
Mahnke Elizabeth J
Bought by
Vanderwiel Elizabeth J and Vanderwiel Jack W
Create a Home Valuation Report for This Property
The Home Valuation Report is an in-depth analysis detailing your home's value as well as a comparison with similar homes in the area
Home Values in the Area
Average Home Value in this Area
Purchase History
| Date | Buyer | Sale Price | Title Company |
|---|---|---|---|
| Cosonero Llc | $185,000 | None Listed On Document | |
| Elizabeth J Vander Wiel Living Trust | -- | None Listed On Document | |
| Vanderwiel Elizabeth J | -- | -- |
Source: Public Records
Tax History Compared to Growth
Tax History
| Year | Tax Paid | Tax Assessment Tax Assessment Total Assessment is a certain percentage of the fair market value that is determined by local assessors to be the total taxable value of land and additions on the property. | Land | Improvement |
|---|---|---|---|---|
| 2025 | $3,934 | $228,800 | $53,300 | $175,500 |
| 2024 | $3,934 | $219,100 | $50,800 | $168,300 |
| 2023 | $3,822 | $219,100 | $50,800 | $168,300 |
| 2022 | $3,790 | $174,400 | $42,100 | $132,300 |
| 2021 | $3,574 | $174,400 | $42,100 | $132,300 |
| 2020 | $3,706 | $155,100 | $37,800 | $117,300 |
| 2019 | $3,454 | $155,100 | $37,800 | $117,300 |
| 2018 | $3,412 | $140,300 | $33,700 | $106,600 |
| 2017 | $3,090 | $140,300 | $33,700 | $106,600 |
| 2016 | $3,002 | $126,000 | $30,300 | $95,700 |
| 2015 | $3,002 | $126,000 | $30,300 | $95,700 |
| 2014 | $2,876 | $120,300 | $28,700 | $91,600 |
Source: Public Records
Map
Nearby Homes