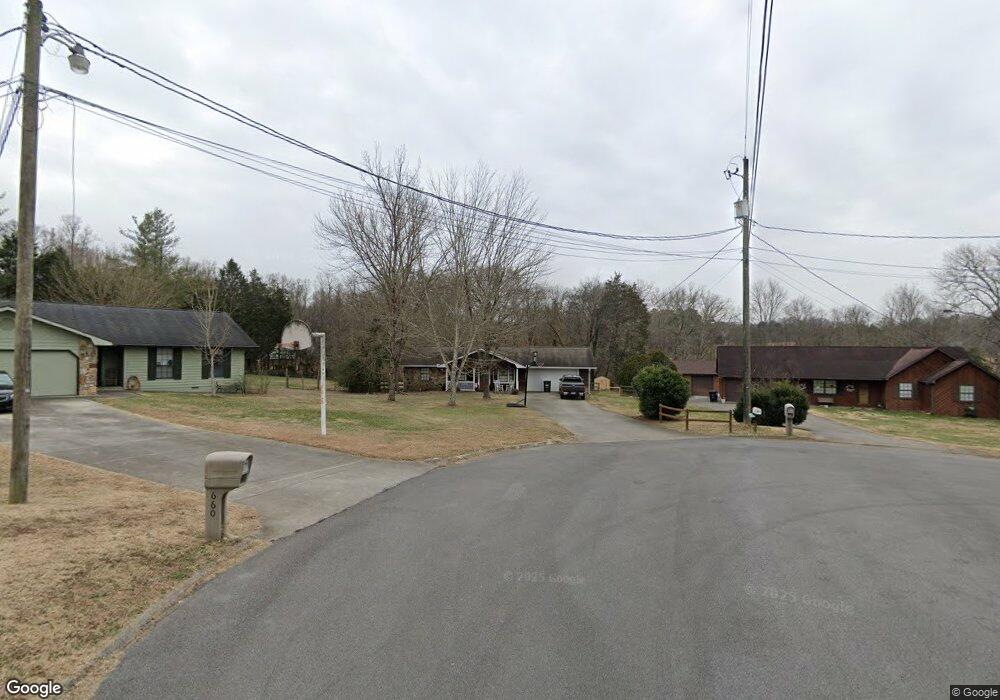
664 Dwight Ln Sevierville, TN 37876
Estimated Value: $316,900 - $345,000
3
Beds
2
Baths
1,175
Sq Ft
$282/Sq Ft
Est. Value
About This Home
This home is located at 664 Dwight Ln, Sevierville, TN 37876 and is currently estimated at $330,950, approximately $281 per square foot. 664 Dwight Ln is a home located in Sevier County with nearby schools including Northview Elementary School, Catons Chapel Elementary School, and Jones Cove Elementary School.
Ownership History
Date
Name
Owned For
Owner Type
Purchase Details
Closed on
Aug 19, 2014
Sold by
Dehoff Judith K
Bought by
Aleman Cruz Oscar Aleman and Aleman Cruz Tori
Current Estimated Value
Home Financials for this Owner
Home Financials are based on the most recent Mortgage that was taken out on this home.
Original Mortgage
$119,790
Outstanding Balance
$92,319
Interest Rate
4.4%
Mortgage Type
FHA
Estimated Equity
$238,631
Purchase Details
Closed on
Jun 23, 2009
Sold by
Wishard W Alan
Bought by
Wishard Judith K
Purchase Details
Closed on
May 23, 2006
Sold by
Roberts Thomas H
Bought by
Wishard W Alan
Purchase Details
Closed on
Jun 29, 2001
Bought by
Roberts Thomas H and Roberts Kristie O
Home Financials for this Owner
Home Financials are based on the most recent Mortgage that was taken out on this home.
Original Mortgage
$84,331
Interest Rate
7.23%
Purchase Details
Closed on
Jul 24, 1997
Bought by
Willis Curtis B A and Willis Jackie H
Create a Home Valuation Report for This Property
The Home Valuation Report is an in-depth analysis detailing your home's value as well as a comparison with similar homes in the area
Home Values in the Area
Average Home Value in this Area
Purchase History
| Date | Buyer | Sale Price | Title Company |
|---|---|---|---|
| Aleman Cruz Oscar Aleman | $122,000 | -- | |
| Wishard Judith K | -- | -- | |
| Wishard W Alan | $128,500 | -- | |
| Roberts Thomas H | $85,000 | -- | |
| Willis Curtis B A | $74,900 | -- |
Source: Public Records
Mortgage History
| Date | Status | Borrower | Loan Amount |
|---|---|---|---|
| Open | Aleman Cruz Oscar Aleman | $119,790 | |
| Previous Owner | Willis Curtis B A | $84,331 |
Source: Public Records
Tax History Compared to Growth
Tax History
| Year | Tax Paid | Tax Assessment Tax Assessment Total Assessment is a certain percentage of the fair market value that is determined by local assessors to be the total taxable value of land and additions on the property. | Land | Improvement |
|---|---|---|---|---|
| 2025 | $603 | $40,775 | $10,000 | $30,775 |
| 2024 | $603 | $40,775 | $10,000 | $30,775 |
| 2023 | $603 | $40,775 | $0 | $0 |
| 2022 | $603 | $40,775 | $10,000 | $30,775 |
| 2021 | $603 | $40,775 | $10,000 | $30,775 |
| 2020 | $550 | $40,775 | $10,000 | $30,775 |
| 2019 | $550 | $29,575 | $10,000 | $19,575 |
| 2018 | $550 | $29,575 | $10,000 | $19,575 |
| 2017 | $550 | $29,575 | $10,000 | $19,575 |
| 2016 | $550 | $29,575 | $10,000 | $19,575 |
| 2015 | -- | $29,750 | $0 | $0 |
| 2014 | $485 | $29,739 | $0 | $0 |
Source: Public Records
Map
Nearby Homes
- 615 Dwight Ln
- 1262 Atchley Dr
- 2 Winfield Dunn Pkwy
- 1483 Catlettsburg Rd
- Lot 34 Winfield Dunn Pkwy
- 273 Cherokee Path Way
- 269 Cherokee Path Way
- 1114 Junaluska Way
- Lot 2 Winfield Dunn Pkwy
- Lot 3 Winfield Dunn Pkwy
- 1014 Walini Way
- 894 Lake View Loop
- 1010 Ravens Ford Way
- 898 Lake View Loop
- 1012 Ravens Ford Way
- 1005 Walini Way
- 1003 Walini Way
- 214 Tsali Way
- 206 S Smoky Mountain Way
- 201 Tsali Way
- 663 Dwight Ln
- 660 Dwight Ln
- 659 Dwight Ln
- 656 Dwight Ln
- 655 Dwight Ln
- 652 Dwight Ln
- 1800 Frankie Ln
- 1102 Alder Branch Rd
- 1804 Frankie Ln
- 649 Dwight Ln
- 648 Dwight Ln
- 1808 Frankie Ln
- 1805 Frankie Ln
- 641 Dwight Ln
- 644 Dwight Ln
- 1812 Frankie Ln
- 1809 Frankie Ln
- 640 Dwight Ln
- 1104 Alder Branch Rd
- 1816 Frankie Ln