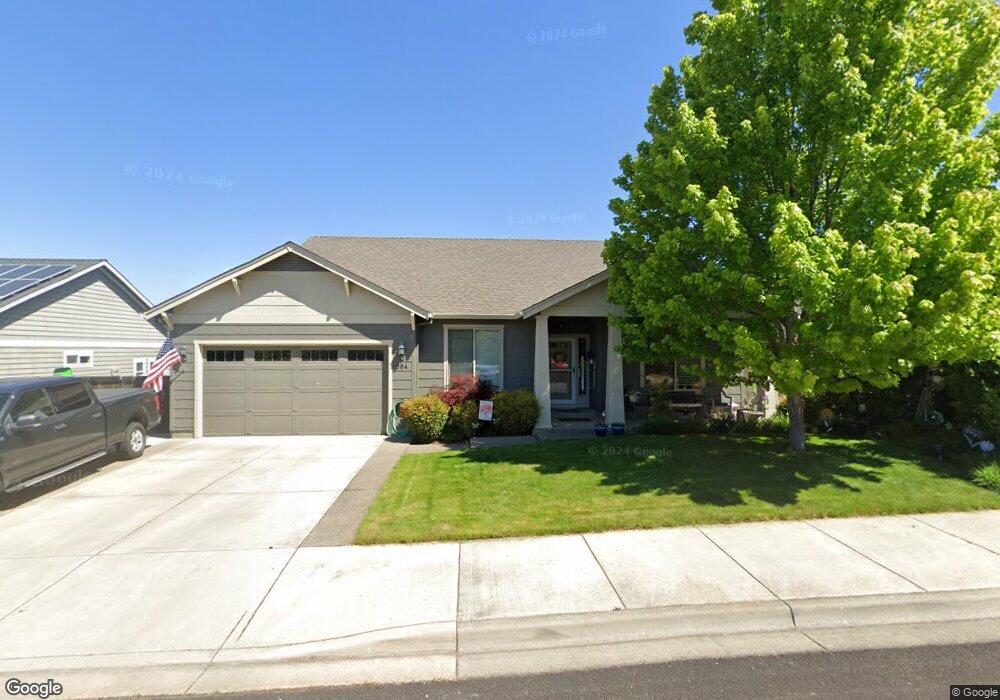
664 Nottingham Terrace Unit Lt21 Eagle Point, OR 97524
Estimated Value: $430,353 - $455,000
3
Beds
2
Baths
1,701
Sq Ft
$260/Sq Ft
Est. Value
About This Home
This home is located at 664 Nottingham Terrace Unit Lt21, Eagle Point, OR 97524 and is currently estimated at $441,838, approximately $259 per square foot. 664 Nottingham Terrace Unit Lt21 is a home located in Jackson County with nearby schools including Eagle Rock Elementary School, Eagle Point Middle School, and White Mountain Middle School.
Ownership History
Date
Name
Owned For
Owner Type
Purchase Details
Closed on
Sep 21, 2016
Sold by
Broadbent John A and Broadbent Tisa M
Bought by
Mcfarland Patrick T and Mcfarland Carol L
Current Estimated Value
Purchase Details
Closed on
Apr 29, 2015
Sold by
Karnbach Todd and Karnbach Mandy
Bought by
Broadbent John A and Broadment Tisa M
Home Financials for this Owner
Home Financials are based on the most recent Mortgage that was taken out on this home.
Original Mortgage
$200,000
Interest Rate
3.64%
Mortgage Type
New Conventional
Purchase Details
Closed on
Jul 5, 2012
Sold by
Marley Dog Llc
Bought by
Karnbach Todd and Karnbach Mandy
Home Financials for this Owner
Home Financials are based on the most recent Mortgage that was taken out on this home.
Original Mortgage
$211,224
Interest Rate
3.74%
Mortgage Type
New Conventional
Purchase Details
Closed on
Sep 8, 2010
Sold by
Future Concepts Llc
Bought by
Marley Dog Llc
Create a Home Valuation Report for This Property
The Home Valuation Report is an in-depth analysis detailing your home's value as well as a comparison with similar homes in the area
Home Values in the Area
Average Home Value in this Area
Purchase History
| Date | Buyer | Sale Price | Title Company |
|---|---|---|---|
| Mcfarland Patrick T | $264,900 | Ticor Title Company Of Or | |
| Broadbent John A | $250,000 | Ticor Title Company | |
| Karnbach Todd | $207,000 | Amerititle | |
| Marley Dog Llc | -- | First American |
Source: Public Records
Mortgage History
| Date | Status | Borrower | Loan Amount |
|---|---|---|---|
| Previous Owner | Broadbent John A | $200,000 | |
| Previous Owner | Karnbach Todd | $211,224 |
Source: Public Records
Tax History
| Year | Tax Paid | Tax Assessment Tax Assessment Total Assessment is a certain percentage of the fair market value that is determined by local assessors to be the total taxable value of land and additions on the property. | Land | Improvement |
|---|---|---|---|---|
| 2026 | $2,814 | $206,830 | -- | -- |
| 2025 | $2,748 | $200,810 | $83,330 | $117,480 |
| 2024 | $2,748 | $194,970 | $80,910 | $114,060 |
| 2023 | $2,655 | $189,300 | $78,550 | $110,750 |
| 2022 | $2,582 | $189,300 | $78,550 | $110,750 |
| 2021 | $2,506 | $183,790 | $76,260 | $107,530 |
| 2020 | $2,662 | $178,440 | $74,040 | $104,400 |
| 2019 | $2,622 | $168,210 | $69,800 | $98,410 |
| 2018 | $2,572 | $163,320 | $67,770 | $95,550 |
| 2017 | $2,509 | $163,320 | $67,770 | $95,550 |
| 2016 | $2,460 | $153,960 | $63,880 | $90,080 |
| 2015 | $2,379 | $153,960 | $63,880 | $90,080 |
| 2014 | $2,311 | $145,130 | $60,210 | $84,920 |
Source: Public Records
Map
Nearby Homes
- 700 Nottingham Terrace
- 631 Nottingham Terrace
- 712 Nottingham Terrace
- 417 E Rolling Hills Dr
- 945 Win Way
- 208 Northview Dr Unit 1B
- 1017 Havenwood Dr
- 110 Linton Way
- 1023 Highlands Dr
- 925 Sellwood Dr
- 912 Stonewater Dr
- 438 Westminster Dr
- 911 Stonewater Dr
- 917 Stonewater Dr
- 407 N Deanjou Ave
- 403 N Deanjou Ave
- 545 N Heights Dr
- 468 Merlee Cir
- 417 Crystal Dr
- 388 Crystal Dr
- 664 Nottingham Terrace
- 658 Nottingham Terrace
- 658 Nottingham Terrace Unit Lt22
- 670 Nottingham Terrace
- 670 Nottingham Terrace Unit Lt20
- 670 Nottingham Terrace
- 676 Nottingham Terrace Unit Lt19
- 665 Nottingham Terrace Unit Lt15
- 665 Nottingham Terrace
- 652 Nottingham Terrace
- 671 Nottingham Terrace Unit Lt16
- 671 Nottingham Terrace
- 659 Nottingham Terrace Unit Lt14
- 659 Nottingham Terrace
- 677 Nottingham Terrace Unit Lt17
- 677 Nottingham Terrace
- 353 Northview Dr
- 689 Nottingham Terrace
- 683 Nottingham Terrace Unit Lt18
- 683 Nottingham Terrace
Your Personal Tour Guide
Ask me questions while you tour the home.