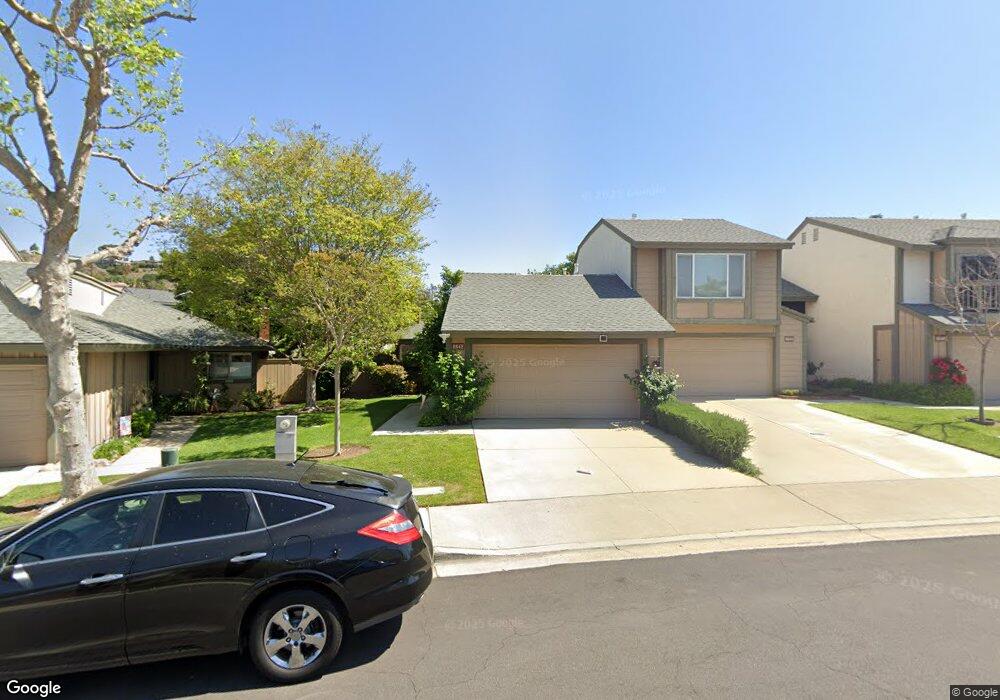
6642 Vista Loma Yorba Linda, CA 92886
Estimated Value: $707,485 - $784,000
2
Beds
2
Baths
1,094
Sq Ft
$692/Sq Ft
Est. Value
About This Home
This home is located at 6642 Vista Loma, Yorba Linda, CA 92886 and is currently estimated at $757,121, approximately $692 per square foot. 6642 Vista Loma is a home located in Orange County with nearby schools including Glenknoll Elementary, Bernardo Yorba Middle School, and Ivycrest Montessori Private School - Yorba Linda.
Ownership History
Date
Name
Owned For
Owner Type
Purchase Details
Closed on
Nov 9, 2009
Sold by
Marie Paula J Ste
Bought by
Marie Paula J Ste and The Paula J Ste Marie Revocable Trust
Current Estimated Value
Purchase Details
Closed on
Mar 3, 1999
Sold by
Higashi Stanley T
Bought by
Stemarie Paula
Home Financials for this Owner
Home Financials are based on the most recent Mortgage that was taken out on this home.
Original Mortgage
$147,944
Interest Rate
6.98%
Mortgage Type
FHA
Purchase Details
Closed on
Dec 8, 1998
Sold by
Higashi Stanley T
Bought by
Higashi Stanley T
Home Financials for this Owner
Home Financials are based on the most recent Mortgage that was taken out on this home.
Original Mortgage
$85,650
Interest Rate
6.78%
Purchase Details
Closed on
Feb 22, 1995
Sold by
Higashi Stanley T
Bought by
Higashi Stanley T and Stanley T Higashi Family Trust
Create a Home Valuation Report for This Property
The Home Valuation Report is an in-depth analysis detailing your home's value as well as a comparison with similar homes in the area
Home Values in the Area
Average Home Value in this Area
Purchase History
| Date | Buyer | Sale Price | Title Company |
|---|---|---|---|
| Marie Paula J Ste | -- | None Available | |
| Stemarie Paula | $150,000 | Orange Coast Title | |
| Higashi Stanley T | -- | United Title | |
| Higashi Stanley T | -- | -- |
Source: Public Records
Mortgage History
| Date | Status | Borrower | Loan Amount |
|---|---|---|---|
| Previous Owner | Stemarie Paula | $147,944 | |
| Previous Owner | Higashi Stanley T | $85,650 |
Source: Public Records
Tax History Compared to Growth
Tax History
| Year | Tax Paid | Tax Assessment Tax Assessment Total Assessment is a certain percentage of the fair market value that is determined by local assessors to be the total taxable value of land and additions on the property. | Land | Improvement |
|---|---|---|---|---|
| 2025 | $2,921 | $234,987 | $115,262 | $119,725 |
| 2024 | $2,921 | $230,380 | $113,002 | $117,378 |
| 2023 | $2,849 | $225,863 | $110,786 | $115,077 |
| 2022 | $2,803 | $221,435 | $108,614 | $112,821 |
| 2021 | $2,748 | $217,094 | $106,485 | $110,609 |
| 2020 | $2,734 | $214,868 | $105,393 | $109,475 |
| 2019 | $2,647 | $210,655 | $103,326 | $107,329 |
| 2018 | $2,608 | $206,525 | $101,300 | $105,225 |
| 2017 | $2,560 | $202,476 | $99,314 | $103,162 |
| 2016 | $2,505 | $198,506 | $97,366 | $101,140 |
| 2015 | $2,462 | $195,525 | $95,904 | $99,621 |
| 2014 | $2,391 | $191,695 | $94,025 | $97,670 |
Source: Public Records
Map
Nearby Homes
- 6692 Moselle Cir
- 6681 Palma Cir
- 6692 Palma Cir
- 19816 White Spring Ln Unit 36
- 5497 E Willow Woods Ln Unit C
- 5466 E Willow Woods Ln Unit A
- 6821 Rocky Grove Ct Unit 13
- 5455 E Candlewood Cir Unit 61
- 19622 Crestknoll Dr
- 6478 Horse Shoe Ln Unit 9
- 6437 Horse Shoe Ln Unit 2
- 6473 Horse Shoe Ln Unit 6
- 5815 E La Palma Ave Unit 133
- 5815 E La Palma Ave Unit 190
- 5815 E La Palma Ave Unit 74
- 1738 N Cedar Glen Dr Unit B
- 20065 Berkeley Way
- 19931 Crestknoll Dr
- 20267 Clear River Ln Unit 7
- 1726 N Oak Knoll Dr Unit D
- 6644 Vista Loma
- 6646 Vista Loma
- 6636 Vista Loma
- 6634 Vista Loma
- 6652 Vista Loma
- 6632 Vista Loma
- 6656 Vista Loma
- 6626 Vista Loma
- 6662 Vista Loma
- 6645 Vista Loma
- 6701 Moselle Cir
- 6695 Moselle Cir
- 6750 Tahitian Cir
- 6641 Vista Loma
- 6635 Vista Loma
- 6703 Moselle Cir
- 6700 Moselle Cir
- 6624 Vista Loma
- 6655 Vista Loma
- 6691 Moselle Cir