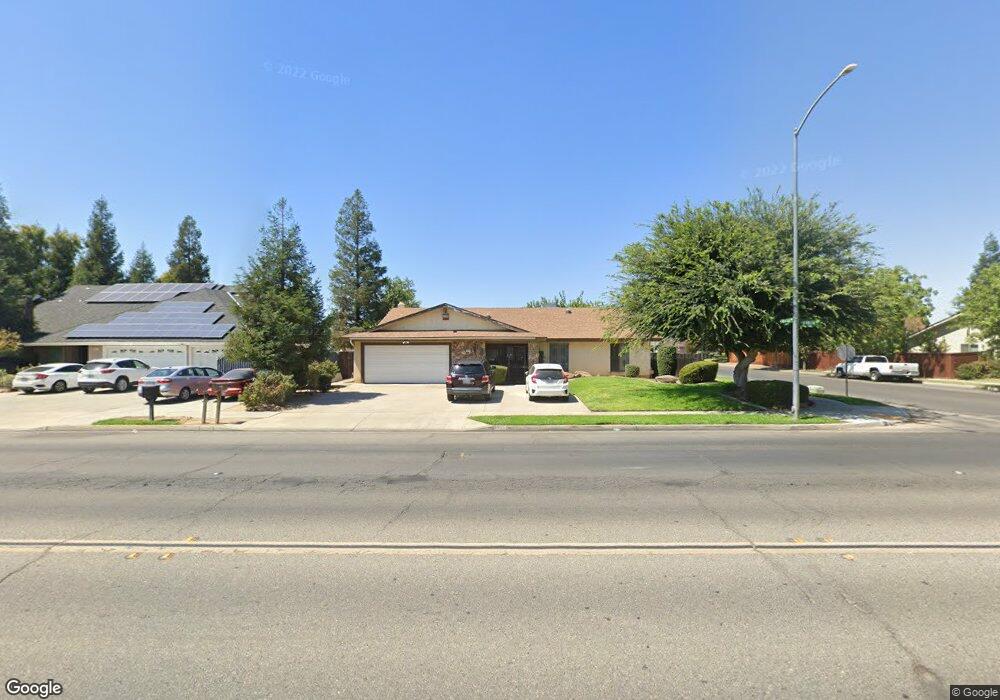
6643 N Maroa Ave Fresno, CA 93704
Bullard NeighborhoodEstimated Value: $449,985 - $595,000
4
Beds
2
Baths
2,146
Sq Ft
$238/Sq Ft
Est. Value
About This Home
This home is located at 6643 N Maroa Ave, Fresno, CA 93704 and is currently estimated at $509,746, approximately $237 per square foot. 6643 N Maroa Ave is a home located in Fresno County with nearby schools including Kratt Elementary School, Tenaya Middle School, and Bullard High School.
Ownership History
Date
Name
Owned For
Owner Type
Purchase Details
Closed on
Mar 16, 2000
Sold by
Annunciacion Hoff
Bought by
Newell Larry and Newell Luz
Current Estimated Value
Home Financials for this Owner
Home Financials are based on the most recent Mortgage that was taken out on this home.
Original Mortgage
$117,450
Outstanding Balance
$39,834
Interest Rate
8.3%
Estimated Equity
$469,912
Purchase Details
Closed on
Feb 10, 1999
Sold by
Gonzales Romulo F
Bought by
Hoff Anunciacion
Home Financials for this Owner
Home Financials are based on the most recent Mortgage that was taken out on this home.
Original Mortgage
$110,000
Interest Rate
6.78%
Mortgage Type
Seller Take Back
Purchase Details
Closed on
Mar 3, 1994
Sold by
Gonzales Lydia V and Kazmi Lydia V
Bought by
Gonzales Romulo F and Gonzales Lydia
Home Financials for this Owner
Home Financials are based on the most recent Mortgage that was taken out on this home.
Original Mortgage
$89,600
Interest Rate
5.75%
Create a Home Valuation Report for This Property
The Home Valuation Report is an in-depth analysis detailing your home's value as well as a comparison with similar homes in the area
Home Values in the Area
Average Home Value in this Area
Purchase History
| Date | Buyer | Sale Price | Title Company |
|---|---|---|---|
| Newell Larry | $130,500 | Fidelity National Title Co | |
| Hoff Anunciacion | $110,000 | Fidelity National Title Co | |
| Hoff Anunciacion | -- | Fidelity National Title Co | |
| Gonzales Romulo F | -- | North American Title Company |
Source: Public Records
Mortgage History
| Date | Status | Borrower | Loan Amount |
|---|---|---|---|
| Open | Newell Larry | $117,450 | |
| Previous Owner | Hoff Anunciacion | $110,000 | |
| Previous Owner | Gonzales Romulo F | $89,600 |
Source: Public Records
Tax History Compared to Growth
Tax History
| Year | Tax Paid | Tax Assessment Tax Assessment Total Assessment is a certain percentage of the fair market value that is determined by local assessors to be the total taxable value of land and additions on the property. | Land | Improvement |
|---|---|---|---|---|
| 2025 | $2,511 | $200,551 | $47,634 | $152,917 |
| 2023 | $2,463 | $192,765 | $45,785 | $146,980 |
| 2022 | $2,430 | $188,987 | $44,888 | $144,099 |
| 2021 | $2,363 | $185,282 | $44,008 | $141,274 |
| 2020 | $2,353 | $183,383 | $43,557 | $139,826 |
| 2019 | $2,263 | $179,788 | $42,703 | $137,085 |
| 2018 | $2,214 | $176,264 | $41,866 | $134,398 |
| 2017 | $2,176 | $172,809 | $41,046 | $131,763 |
| 2016 | $2,104 | $169,422 | $40,242 | $129,180 |
| 2015 | $2,072 | $166,878 | $39,638 | $127,240 |
| 2014 | $2,034 | $163,610 | $38,862 | $124,748 |
Source: Public Records
Map
Nearby Homes
- 6607 N Maroa Ave
- 353 W Warner Ave
- 221 W Herndon Ave Unit 130
- 221 W Herndon Ave Unit 49
- 221 W Herndon Ave Unit 87
- 221 W Herndon Ave Unit 66
- 221 W Herndon Ave Unit 37
- 221 W Herndon Ave Unit 50
- 221 W Herndon Ave Unit 71
- 221 W Herndon Ave Unit 59
- 221 W Herndon Ave Unit 132
- 221 W Herndon Ave Unit 27
- 6548 N Poplar Ave
- 355 W Sierra Ave Unit 106
- 7013 N Maroa Ave
- 6338 N Maroa Ave Unit 115
- 317 W Sierra Ave Unit 124
- 317 W Sierra Ave Unit 107
- 317 W Sierra Ave Unit 125
- 375 W Fir Ave
- 6631 N Maroa Ave
- 6634 N Nantucket Ave
- 6619 N Maroa Ave
- 6622 N Nantucket Ave
- 6664 N Nantucket Ave
- 6675 N Maroa Ave
- 6676 N Nantucket Ave
- 6650 N Maroa Ave Unit 217
- 6650 N Maroa Ave Unit 218
- 6650 N Maroa Ave Unit 212
- 6650 N Maroa Ave Unit 211
- 6650 N Maroa Ave Unit 234
- 6650 N Maroa Ave Unit 117
- 6650 N Maroa Ave Unit 118
- 6650 N Maroa Ave Unit 112
- 6650 N Maroa Ave Unit 111
- 6650 N Maroa Ave Unit 133
- 6650 N Maroa Ave Unit 134
- 6650 N Maroa Ave Unit 142
- 6650 N Maroa Ave Unit 123