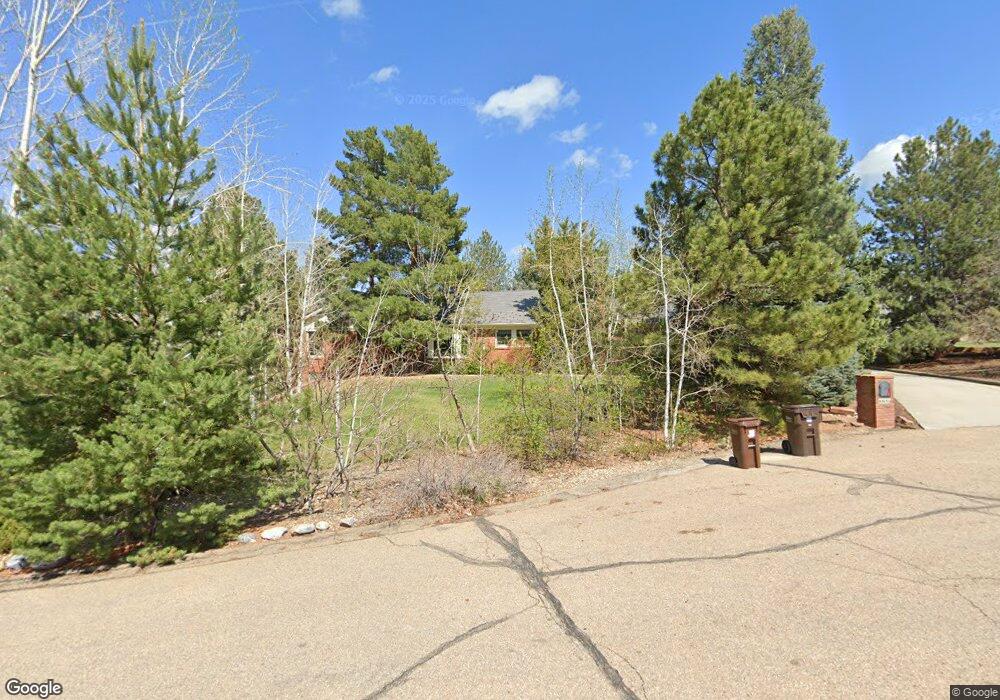
6646 Apache Ct Niwot, CO 80503
Niwot NeighborhoodEstimated Value: $1,052,252 - $1,259,000
4
Beds
3
Baths
1,879
Sq Ft
$618/Sq Ft
Est. Value
About This Home
This home is located at 6646 Apache Ct, Niwot, CO 80503 and is currently estimated at $1,160,813, approximately $617 per square foot. 6646 Apache Ct is a home located in Boulder County with nearby schools including Niwot Elementary School, Sunset Middle School, and Niwot High School.
Ownership History
Date
Name
Owned For
Owner Type
Purchase Details
Closed on
Jan 9, 2009
Sold by
Star Ira
Bought by
Star Ira
Current Estimated Value
Home Financials for this Owner
Home Financials are based on the most recent Mortgage that was taken out on this home.
Original Mortgage
$128,000
Outstanding Balance
$82,194
Interest Rate
5.48%
Mortgage Type
New Conventional
Estimated Equity
$1,078,619
Purchase Details
Closed on
Apr 22, 1996
Sold by
Star Bonnie J and Star Ira
Bought by
Star Ira
Home Financials for this Owner
Home Financials are based on the most recent Mortgage that was taken out on this home.
Original Mortgage
$202,500
Interest Rate
6.62%
Purchase Details
Closed on
Jul 23, 1992
Bought by
Ira Star and Collins Mary Claire
Purchase Details
Closed on
Sep 5, 1990
Bought by
Ira Star and Collins Mary Claire
Purchase Details
Closed on
Sep 6, 1989
Bought by
Ira Star and Collins Mary Claire
Create a Home Valuation Report for This Property
The Home Valuation Report is an in-depth analysis detailing your home's value as well as a comparison with similar homes in the area
Home Values in the Area
Average Home Value in this Area
Purchase History
| Date | Buyer | Sale Price | Title Company |
|---|---|---|---|
| Star Ira | -- | Utc Colorado | |
| Star Ira | -- | Title Services Inc | |
| Ira Star | $205,000 | -- | |
| Ira Star | $178,000 | -- | |
| Ira Star | $187,500 | -- |
Source: Public Records
Mortgage History
| Date | Status | Borrower | Loan Amount |
|---|---|---|---|
| Open | Star Ira | $128,000 | |
| Closed | Star Ira | $202,500 |
Source: Public Records
Tax History
| Year | Tax Paid | Tax Assessment Tax Assessment Total Assessment is a certain percentage of the fair market value that is determined by local assessors to be the total taxable value of land and additions on the property. | Land | Improvement |
|---|---|---|---|---|
| 2025 | $5,892 | $66,694 | $29,319 | $37,375 |
| 2024 | $5,892 | $66,694 | $29,319 | $37,375 |
| 2023 | $5,814 | $66,498 | $27,155 | $43,027 |
| 2022 | $4,857 | $54,578 | $24,471 | $30,107 |
| 2021 | $5,634 | $56,149 | $25,175 | $30,974 |
| 2020 | $5,247 | $52,424 | $18,805 | $33,619 |
| 2019 | $5,229 | $52,424 | $18,805 | $33,619 |
| 2018 | $4,243 | $42,818 | $14,184 | $28,634 |
| 2017 | $3,985 | $47,338 | $15,681 | $31,657 |
| 2016 | $4,069 | $42,816 | $17,432 | $25,384 |
| 2015 | $3,876 | $41,344 | $11,701 | $29,643 |
| 2014 | $4,313 | $41,344 | $11,701 | $29,643 |
Source: Public Records
Map
Nearby Homes
- 6541 Legend Ridge Trail
- 8836 Marathon Rd
- 6689 Asher Ct
- 8906 Little Raven Trail
- 6771 Niwot Hills Dr
- 6695 Jacqueline Ct
- 6692 Jacqueline Ct
- 6696 Jacqueline Ct
- 8840 Niwot Rd
- 9261 Blue Spruce Ln
- 6816 Goldbranch Dr
- 8528 Skyland Dr
- 9260 Shooting Star Ct
- 6851 Goldbranch Dr
- 9258 Niwot Hills Dr
- 6860 Goldbranch Dr
- 8568 Foxhaven Ct
- 8594 Mineral Rd
- 8414 Firethorn Ct
- 8312 Greenwood Dr
- 6666 Apache Ct
- 6626 Apache Ct
- 6645 Cherokee Ct
- 6665 Cherokee Ct
- 6665 Cherokee Ct Unit 1
- 6617 Apache Ct
- 6647 Apache Ct
- 6635 Cherokee Ct
- 8904 Walker Rd
- 6686 Apache Ct
- 6627 Apache Ct
- 6667 Apache Ct
- 6664 Cherokee Ct
- 6625 Cherokee Ct
- 8934 Walker Rd
- 6644 Cherokee Ct
- 8844 Walker Rd
- 8903 Walker Rd
- 6648 Walker Ct
- 8883 Walker Rd
Your Personal Tour Guide
Ask me questions while you tour the home.