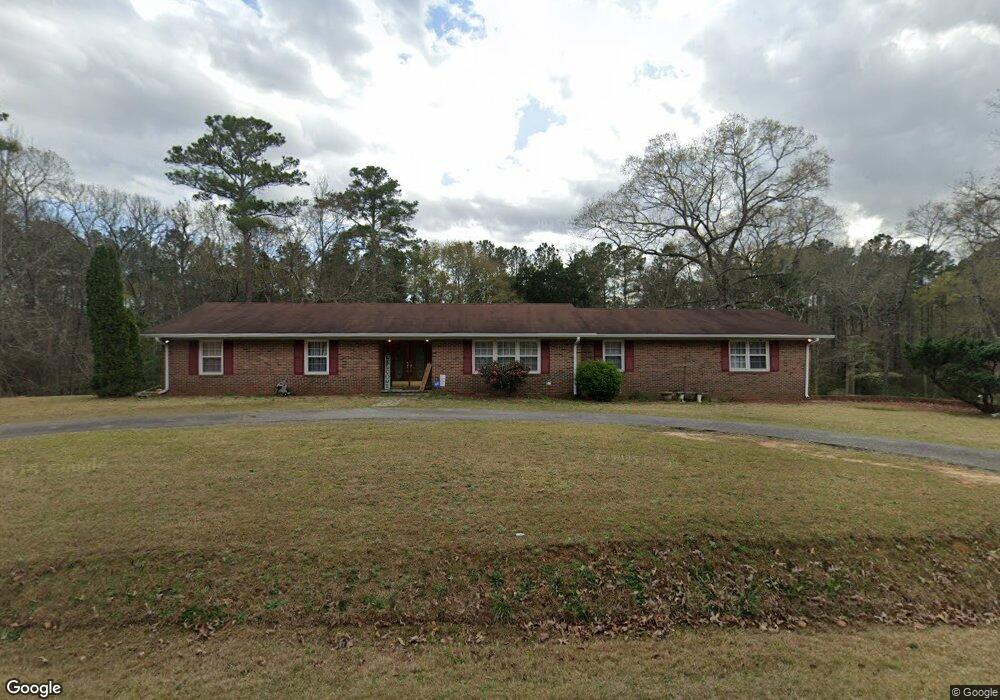
6649 Chriswood Dr Macon, GA 31216
Estimated Value: $276,580 - $307,000
5
Beds
4
Baths
2,525
Sq Ft
$116/Sq Ft
Est. Value
About This Home
This home is located at 6649 Chriswood Dr, Macon, GA 31216 and is currently estimated at $292,395, approximately $115 per square foot. 6649 Chriswood Dr is a home located in Bibb County with nearby schools including Heard Elementary School, Rutland Middle School, and Rutland High School.
Ownership History
Date
Name
Owned For
Owner Type
Purchase Details
Closed on
Sep 18, 2020
Sold by
Palladium Metals Llc
Bought by
Elder Tony and Elder Stephanie
Current Estimated Value
Home Financials for this Owner
Home Financials are based on the most recent Mortgage that was taken out on this home.
Original Mortgage
$192,154
Outstanding Balance
$169,815
Interest Rate
2.8%
Mortgage Type
FHA
Estimated Equity
$122,580
Purchase Details
Closed on
Sep 27, 2019
Sold by
Palladium Metals Llc
Bought by
Stanton Marilyn L
Purchase Details
Closed on
Nov 21, 2005
Sold by
Hayes Douglas A and Hayes Faye B
Bought by
Jackson Cheryl L and Jackson Evenezer B
Home Financials for this Owner
Home Financials are based on the most recent Mortgage that was taken out on this home.
Original Mortgage
$11,150
Interest Rate
6%
Mortgage Type
New Conventional
Purchase Details
Closed on
Nov 30, 1998
Sold by
Stanton C Hayden
Bought by
Stanton Marilyn L
Create a Home Valuation Report for This Property
The Home Valuation Report is an in-depth analysis detailing your home's value as well as a comparison with similar homes in the area
Home Values in the Area
Average Home Value in this Area
Purchase History
| Date | Buyer | Sale Price | Title Company |
|---|---|---|---|
| Elder Tony | $195,700 | None Available | |
| Stanton Marilyn L | -- | None Available | |
| Palladium Metals Llc | $103,500 | None Available | |
| Jackson Cheryl L | $223,000 | None Available | |
| Stanton Marilyn L | -- | -- |
Source: Public Records
Mortgage History
| Date | Status | Borrower | Loan Amount |
|---|---|---|---|
| Open | Elder Tony | $192,154 | |
| Previous Owner | Jackson Cheryl L | $11,150 |
Source: Public Records
Tax History Compared to Growth
Tax History
| Year | Tax Paid | Tax Assessment Tax Assessment Total Assessment is a certain percentage of the fair market value that is determined by local assessors to be the total taxable value of land and additions on the property. | Land | Improvement |
|---|---|---|---|---|
| 2025 | $1,998 | $88,287 | $14,000 | $74,287 |
| 2024 | $2,036 | $87,186 | $14,000 | $73,186 |
| 2023 | $1,412 | $80,583 | $14,000 | $66,583 |
| 2022 | $3,064 | $95,514 | $11,718 | $83,796 |
| 2021 | $2,709 | $78,280 | $9,274 | $69,006 |
| 2020 | $1,607 | $60,020 | $7,812 | $52,208 |
| 2019 | $1,748 | $58,538 | $7,812 | $50,726 |
| 2018 | $2,856 | $58,538 | $7,812 | $50,726 |
| 2017 | $1,267 | $47,984 | $7,122 | $40,862 |
| 2016 | $1,160 | $47,984 | $7,122 | $40,862 |
| 2015 | $1,612 | $47,270 | $7,122 | $40,148 |
| 2014 | $1,612 | $47,270 | $7,122 | $40,148 |
Source: Public Records
Map
Nearby Homes
- 0 Ponderosa Dr
- 6530 Bevin Dr
- 116 Wynens Way
- 4037 Liberty Estates Dr
- 3150 Holleman Dr
- 4025 Liberty Estates Dr
- 261 Amanda Dr
- 0 Houston Rd Unit 10572705
- 268 Amanda Dr
- 112 Alan Ct Unit 159
- 708 Coopers Lnd
- 3160 Walden Rd
- DUPONT Plan at Quail Ridge
- GARDNER Plan at Quail Ridge
- KINGSTON Plan at Quail Ridge
- ESSEX Plan at Quail Ridge
- 00 Houston Rd
- 6045 Cara Dr
- 408 Resting Fawn Place
- 6621 Chriswood Dr
- 6654 Chriswood Dr
- 0 Chriswood Dr Unit 8843290
- 0 Chriswood Dr Unit 8685328
- 0 Chriswood Dr Unit 8388332
- 0 Chriswood Dr Unit 7612057
- 0 Chriswood Dr Unit 7563485
- 0 Chriswood Dr Unit 8774984
- 0 Chriswood Dr Unit 8812815
- 0 Chriswood Dr Unit 8906133
- 6709 Chriswood Dr
- 0 Chriswood Dr Unit 7293919
- 0 Chriswood Dr
- 6671 Chriswood Dr
- 6626 Chriswood Dr
- 6536 Lynndale Dr
- 0 Lynndale Dr
- 6603 Chriswood Dr
- 6608 Chriswood Dr
- 6518 Lynndale Dr