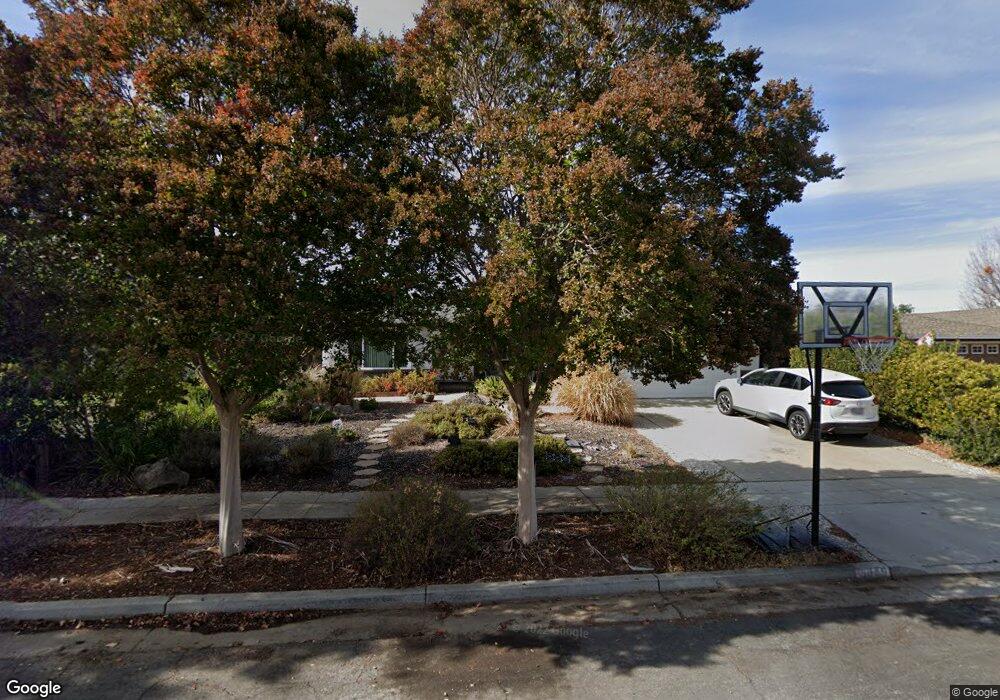
6649 Mount Holly Dr San Jose, CA 95120
Shadow Brook I NeighborhoodEstimated Value: $2,032,562 - $2,311,000
4
Beds
2
Baths
1,999
Sq Ft
$1,088/Sq Ft
Est. Value
About This Home
This home is located at 6649 Mount Holly Dr, San Jose, CA 95120 and is currently estimated at $2,174,891, approximately $1,087 per square foot. 6649 Mount Holly Dr is a home located in Santa Clara County with nearby schools including Simonds Elementary School, Bret Harte Middle School, and Leland High School.
Ownership History
Date
Name
Owned For
Owner Type
Purchase Details
Closed on
May 4, 2011
Sold by
Baughman Michael A
Bought by
Baughman Michael A
Current Estimated Value
Home Financials for this Owner
Home Financials are based on the most recent Mortgage that was taken out on this home.
Original Mortgage
$576,000
Outstanding Balance
$35,411
Interest Rate
4.84%
Mortgage Type
New Conventional
Estimated Equity
$2,139,480
Purchase Details
Closed on
Sep 23, 2010
Sold by
Baughman Allen
Bought by
Baughman Michael
Purchase Details
Closed on
Jul 25, 1996
Sold by
Mohabodhi Society Of Usa
Bought by
Baughman Michael A
Home Financials for this Owner
Home Financials are based on the most recent Mortgage that was taken out on this home.
Original Mortgage
$1,500,000
Outstanding Balance
$119,734
Interest Rate
8.32%
Estimated Equity
$2,055,157
Create a Home Valuation Report for This Property
The Home Valuation Report is an in-depth analysis detailing your home's value as well as a comparison with similar homes in the area
Home Values in the Area
Average Home Value in this Area
Purchase History
| Date | Buyer | Sale Price | Title Company |
|---|---|---|---|
| Baughman Michael A | -- | Orange Coast Title | |
| Baughman Michael | $248,000 | None Available | |
| Baughman Michael A | $2,000,000 | Chicago Title Co |
Source: Public Records
Mortgage History
| Date | Status | Borrower | Loan Amount |
|---|---|---|---|
| Open | Baughman Michael A | $576,000 | |
| Open | Baughman Michael A | $1,500,000 |
Source: Public Records
Tax History Compared to Growth
Tax History
| Year | Tax Paid | Tax Assessment Tax Assessment Total Assessment is a certain percentage of the fair market value that is determined by local assessors to be the total taxable value of land and additions on the property. | Land | Improvement |
|---|---|---|---|---|
| 2025 | $6,209 | $353,733 | $127,337 | $226,396 |
| 2024 | $6,209 | $346,798 | $124,841 | $221,957 |
| 2023 | $6,049 | $339,999 | $122,394 | $217,605 |
| 2022 | $5,979 | $333,334 | $119,995 | $213,339 |
| 2021 | $5,784 | $326,799 | $117,643 | $209,156 |
| 2020 | $5,553 | $323,449 | $116,437 | $207,012 |
| 2019 | $5,388 | $317,107 | $114,154 | $202,953 |
| 2018 | $5,303 | $310,890 | $111,916 | $198,974 |
| 2017 | $5,241 | $304,795 | $109,722 | $195,073 |
| 2016 | $4,692 | $298,820 | $107,571 | $191,249 |
| 2015 | $4,651 | $294,333 | $105,956 | $188,377 |
| 2014 | $4,224 | $288,568 | $103,881 | $184,687 |
Source: Public Records
Map
Nearby Homes
- 6628 Wildwood Ct
- 6805 Almaden Rd
- 6579 Cooperage Ct
- 6803 Lenwood Way
- 1122 Hearth Ct
- 6605 Bret Harte Dr
- 6698 Charter Oak Place
- 6565 Stonehill Dr
- 1174 Old Oak Dr
- 6421 Montana Ct
- 1171 Wilhelmina Way
- 6384 Farm Hill Way
- 18950 Graystone Ln
- 6840 Hampton Dr
- 1101 Culligan Blvd
- 1238 Wooded Hills Dr
- 6997 Elwood Rd
- 6898 Shearwater Dr
- 7025 Bret Harte Dr
- 1140 Mallard Ridge Loop
- 6645 Mount Holly Dr
- 6653 Mount Holly Dr
- 6644 Mount Hope Dr
- 6641 Mount Holly Dr
- 6648 Mount Hope Dr
- 6659 Mount Holly Dr
- 6640 Mount Hope Dr
- 6656 Mount Hope Dr
- 6650 Mount Holly Dr
- 6636 Mount Hope Dr
- 6646 Mount Holly Dr
- 6654 Mount Holly Dr
- 6637 Mount Holly Dr
- 6663 Mount Holly Dr
- 6642 Mount Holly Dr
- 6658 Mount Holly Dr
- 6662 Mount Hope Dr
- 6632 Mount Hope Dr
- 6633 Mount Holly Dr
- 6638 Mount Holly Dr