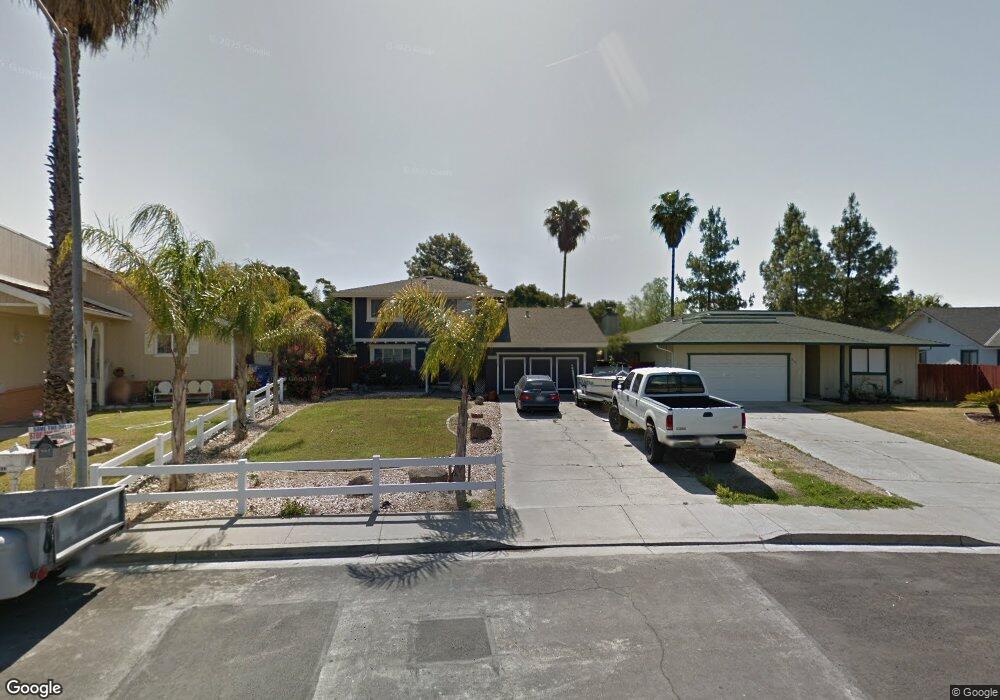
665 Discovery Bay Blvd Discovery Bay, CA 94505
Estimated Value: $586,000 - $735,000
3
Beds
3
Baths
1,975
Sq Ft
$349/Sq Ft
Est. Value
About This Home
This home is located at 665 Discovery Bay Blvd, Discovery Bay, CA 94505 and is currently estimated at $689,507, approximately $349 per square foot. 665 Discovery Bay Blvd is a home located in Contra Costa County with nearby schools including Discovery Bay Elementary School, Excelsior Middle School, and Liberty High School.
Ownership History
Date
Name
Owned For
Owner Type
Purchase Details
Closed on
Jan 17, 2020
Sold by
Ng Bill and Yang Wendy
Bought by
Ng Bill and Yang Wendy
Current Estimated Value
Purchase Details
Closed on
May 16, 2013
Sold by
Bauer Mary K
Bought by
Ng Bill and Yang Wendy
Home Financials for this Owner
Home Financials are based on the most recent Mortgage that was taken out on this home.
Original Mortgage
$203,000
Outstanding Balance
$143,977
Interest Rate
3.5%
Mortgage Type
New Conventional
Estimated Equity
$545,530
Purchase Details
Closed on
Aug 29, 2005
Sold by
Bauer Mary K and Crowell Mary K
Bought by
Bauer Mary K
Purchase Details
Closed on
Jun 25, 2004
Sold by
Crowell Danny Lee
Bought by
Crowell Mary K
Home Financials for this Owner
Home Financials are based on the most recent Mortgage that was taken out on this home.
Original Mortgage
$250,000
Interest Rate
6.29%
Mortgage Type
Stand Alone Refi Refinance Of Original Loan
Create a Home Valuation Report for This Property
The Home Valuation Report is an in-depth analysis detailing your home's value as well as a comparison with similar homes in the area
Home Values in the Area
Average Home Value in this Area
Purchase History
| Date | Buyer | Sale Price | Title Company |
|---|---|---|---|
| Ng Bill | -- | None Available | |
| Ng Bill | $274,500 | Fidelity National Title Co | |
| Bauer Mary K | -- | -- | |
| Crowell Mary K | -- | Chicago Title |
Source: Public Records
Mortgage History
| Date | Status | Borrower | Loan Amount |
|---|---|---|---|
| Open | Ng Bill | $203,000 | |
| Previous Owner | Crowell Mary K | $250,000 |
Source: Public Records
Tax History
| Year | Tax Paid | Tax Assessment Tax Assessment Total Assessment is a certain percentage of the fair market value that is determined by local assessors to be the total taxable value of land and additions on the property. | Land | Improvement |
|---|---|---|---|---|
| 2025 | $5,474 | $337,645 | $128,064 | $209,581 |
| 2024 | $5,074 | $331,025 | $125,553 | $205,472 |
| 2023 | $5,074 | $324,536 | $123,092 | $201,444 |
| 2022 | $4,997 | $318,174 | $120,679 | $197,495 |
| 2021 | $4,892 | $311,936 | $118,313 | $193,623 |
| 2019 | $4,813 | $302,685 | $114,804 | $187,881 |
| 2018 | $4,630 | $296,751 | $112,553 | $184,198 |
| 2017 | $4,702 | $290,934 | $110,347 | $180,587 |
| 2016 | $4,657 | $285,231 | $108,184 | $177,047 |
| 2015 | $4,505 | $280,947 | $106,559 | $174,388 |
| 2014 | $4,411 | $275,444 | $104,472 | $170,972 |
Source: Public Records
Map
Nearby Homes
- 630 Discovery Bay Blvd
- 730 Beaver Ln
- 870 Willow Lake Rd
- 5387 Willow Lake Ct
- 4475 Discovery Point
- 5761 Salmon Ct
- 952 Lido Cir
- 1056 Discovery Bay Blvd
- 51 Discovery Bay Blvd
- 1205 Beach Ct
- 4741 Discovery Point
- 5055 Cabrillo Point
- 4930 Discovery Point
- 1271 Discovery Bay Blvd
- 1240 Marina Cir
- 550 Lee Loop
- 5635 Marlin Dr
- 910 Discovery Bay Blvd
- 5726 Marlin Dr
- 5034 Double Point Way
- 655 Discovery Bay Blvd
- 675 Discovery Bay Blvd
- 685 Discovery Bay Blvd
- 645 Discovery Bay Blvd
- 635 Discovery Bay Blvd
- 650 Discovery Bay Blvd
- 660 Discovery Bay Blvd
- 715 Beaver Ln
- 670 Discovery Bay Blvd
- 640 Discovery Bay Blvd
- 625 Discovery Bay Blvd
- 725 Beaver Ln
- 700 Discovery Bay Blvd
- 615 Discovery Bay Blvd
- 735 Beaver Ln
- 710 Discovery Bay Blvd
- 620 Discovery Bay Blvd
- 700 Beaver Ln
- 605 Discovery Bay Blvd
- 710 Beaver Ln
Your Personal Tour Guide
Ask me questions while you tour the home.