Estimated Value: $119,000 - $240,000
3
Beds
3
Baths
1,162
Sq Ft
$138/Sq Ft
Est. Value
About This Home
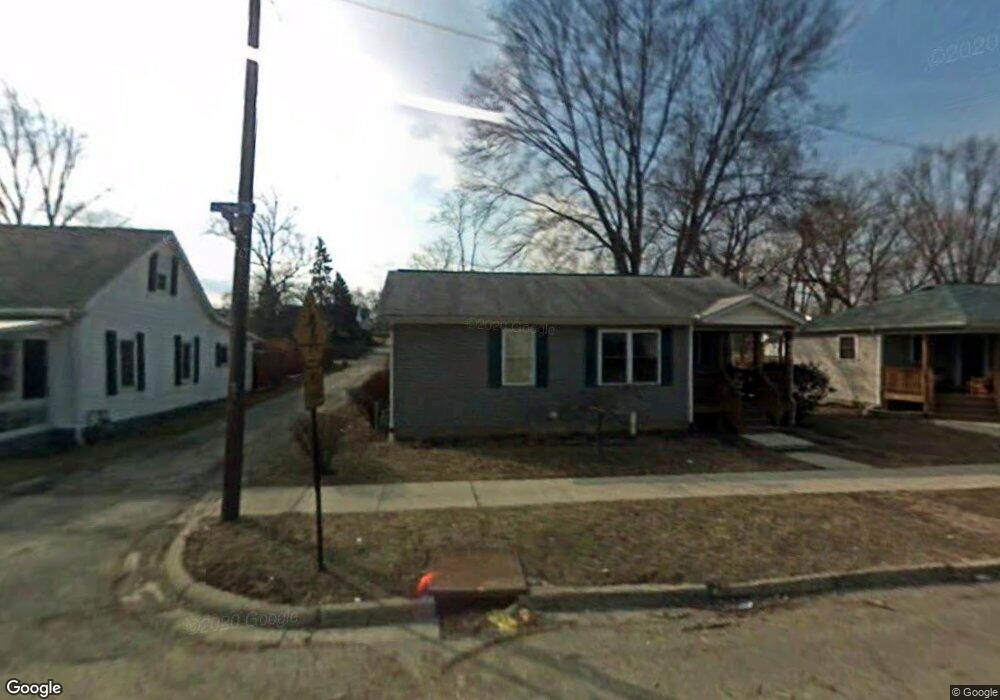
This home is located at 665 E Main St, Xenia, OH 45385 and is currently estimated at $160,366, approximately $138 per square foot. 665 E Main St is a home located in Greene County with nearby schools including Xenia High School, Summit Academy Community School for Alternative Learners - Xenia, and Legacy Christian Academy.
Ownership History
Date
Name
Owned For
Owner Type
Purchase Details
Closed on
Mar 15, 2019
Sold by
Walker Pamela J
Bought by
Myers Misty R
Current Estimated Value
Home Financials for this Owner
Home Financials are based on the most recent Mortgage that was taken out on this home.
Original Mortgage
$63,723
Outstanding Balance
$57,321
Interest Rate
5.62%
Mortgage Type
FHA
Estimated Equity
$103,045
Purchase Details
Closed on
Dec 13, 2002
Sold by
Habitat For Humanity Of Greene County Oh
Bought by
Walker Pamela J
Home Financials for this Owner
Home Financials are based on the most recent Mortgage that was taken out on this home.
Original Mortgage
$55,290
Interest Rate
6.25%
Mortgage Type
Seller Take Back
Purchase Details
Closed on
May 11, 2001
Sold by
Peterson Marshall E
Bought by
Habitat For Humanity Of Greene County
Create a Home Valuation Report for This Property
The Home Valuation Report is an in-depth analysis detailing your home's value as well as a comparison with similar homes in the area
Home Values in the Area
Average Home Value in this Area
Purchase History
| Date | Buyer | Sale Price | Title Company |
|---|---|---|---|
| Myers Misty R | $64,900 | None Available | |
| Walker Pamela J | $55,300 | -- | |
| Habitat For Humanity Of Greene County | -- | -- |
Source: Public Records
Mortgage History
| Date | Status | Borrower | Loan Amount |
|---|---|---|---|
| Open | Myers Misty R | $63,723 | |
| Previous Owner | Walker Pamela J | $55,290 |
Source: Public Records
Tax History
| Year | Tax Paid | Tax Assessment Tax Assessment Total Assessment is a certain percentage of the fair market value that is determined by local assessors to be the total taxable value of land and additions on the property. | Land | Improvement |
|---|---|---|---|---|
| 2024 | $1,632 | $37,480 | $2,300 | $35,180 |
| 2023 | $1,604 | $37,480 | $2,300 | $35,180 |
| 2022 | $1,327 | $26,460 | $2,090 | $24,370 |
| 2021 | $1,345 | $26,460 | $2,090 | $24,370 |
| 2020 | $1,289 | $26,460 | $2,090 | $24,370 |
| 2019 | $1,219 | $24,180 | $2,200 | $21,980 |
| 2018 | $1,223 | $24,180 | $2,200 | $21,980 |
| 2017 | $1,251 | $24,180 | $2,200 | $21,980 |
| 2016 | $1,192 | $23,140 | $2,200 | $20,940 |
| 2015 | $3,978 | $23,140 | $2,200 | $20,940 |
| 2014 | $4,584 | $23,140 | $2,200 | $20,940 |
Source: Public Records
Map
Nearby Homes
Your Personal Tour Guide
Ask me questions while you tour the home.