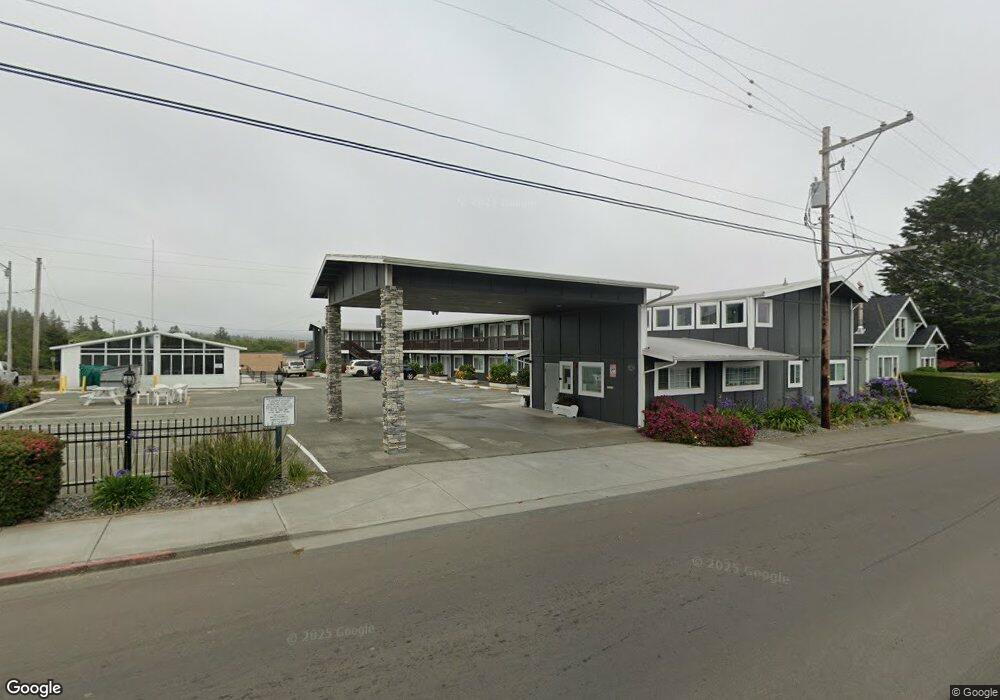
665 L St Crescent City, CA 95531
Estimated Value: $2,657,693
Studio
--
Bath
--
Sq Ft
24,829
Sq Ft
About This Home
This home is located at 665 L St, Crescent City, CA 95531 and is currently estimated at $2,657,693. 665 L St is a home located in Del Norte County with nearby schools including Joe Hamilton Elementary School, Crescent Elk Middle School, and Del Norte High School.
Ownership History
Date
Name
Owned For
Owner Type
Purchase Details
Closed on
Nov 19, 2020
Sold by
Jenny Ye Depew 2016 Family Trust and Depew Jenny Ye
Bought by
County Of Del Norte
Current Estimated Value
Purchase Details
Closed on
Dec 14, 2016
Sold by
Sydathong Jenny
Bought by
Depew Jenny Ye
Purchase Details
Closed on
Jun 9, 2011
Sold by
Sydathong Seng
Bought by
Sydathong Jenny
Purchase Details
Closed on
Feb 13, 2006
Sold by
Marsh Thomas William and Rattan Satma
Bought by
Sydathong Seng and Sydathong Jenny
Home Financials for this Owner
Home Financials are based on the most recent Mortgage that was taken out on this home.
Original Mortgage
$744,000
Interest Rate
6.2%
Mortgage Type
Purchase Money Mortgage
Create a Home Valuation Report for This Property
The Home Valuation Report is an in-depth analysis detailing your home's value as well as a comparison with similar homes in the area
Home Values in the Area
Average Home Value in this Area
Purchase History
| Date | Buyer | Sale Price | Title Company |
|---|---|---|---|
| County Of Del Norte | $1,900,000 | First American Title | |
| Depew Jenny Ye | -- | None Available | |
| Sydathong Jenny | -- | None Available | |
| Sydathong Seng | $1,140,000 | Crescent Land Title Co |
Source: Public Records
Mortgage History
| Date | Status | Borrower | Loan Amount |
|---|---|---|---|
| Previous Owner | Sydathong Seng | $744,000 |
Source: Public Records
Tax History
| Year | Tax Paid | Tax Assessment Tax Assessment Total Assessment is a certain percentage of the fair market value that is determined by local assessors to be the total taxable value of land and additions on the property. | Land | Improvement |
|---|---|---|---|---|
| 2025 | -- | -- | -- | -- |
| 2024 | -- | -- | -- | -- |
| 2023 | -- | -- | -- | -- |
| 2022 | $0 | $11,408 | $0 | $11,408 |
| 2021 | -- | $798,670 | $200,000 | $598,670 |
| 2020 | $8,464 | $798,670 | $200,000 | $598,670 |
| 2019 | $8,476 | $797,274 | $186,395 | $610,879 |
| 2018 | $8,374 | $788,534 | $186,395 | $602,139 |
| 2017 | $8,403 | $804,286 | $190,122 | $614,164 |
| 2016 | $8,423 | $789,092 | $186,395 | $602,697 |
| 2015 | $8,263 | $780,563 | $183,596 | $596,967 |
| 2014 | $7,756 | $710,209 | $162,735 | $547,474 |
Source: Public Records
Map
Nearby Homes
Your Personal Tour Guide
Ask me questions while you tour the home.