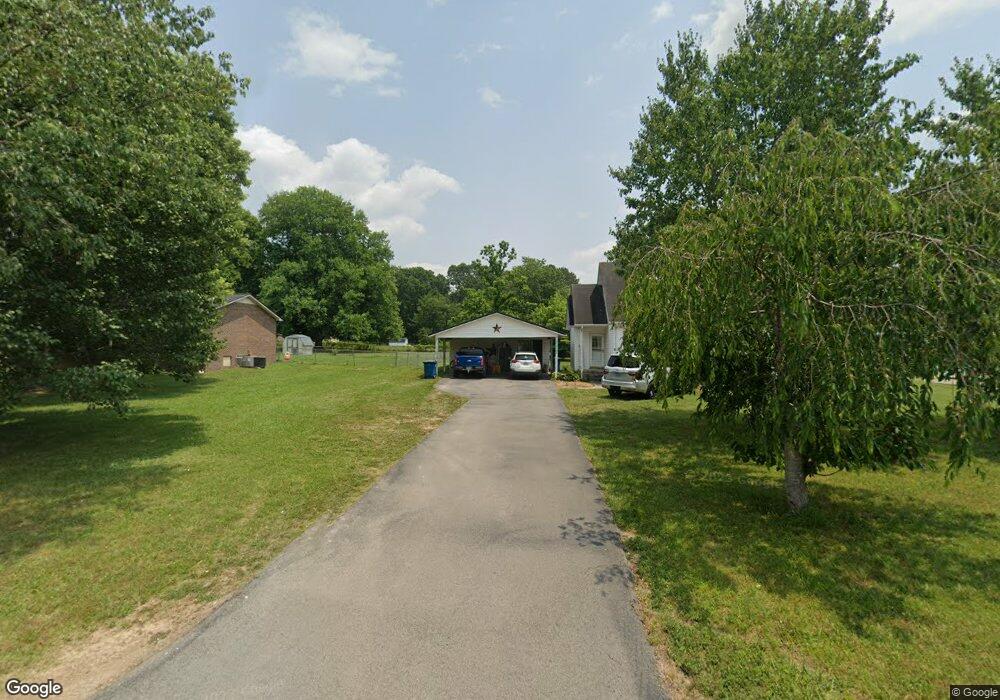
665 Old Bushy Branch Rd Manchester, TN 37355
Estimated Value: $242,390 - $321,000
--
Bed
2
Baths
1,704
Sq Ft
$168/Sq Ft
Est. Value
About This Home
This home is located at 665 Old Bushy Branch Rd, Manchester, TN 37355 and is currently estimated at $285,598, approximately $167 per square foot. 665 Old Bushy Branch Rd is a home located in Coffee County with nearby schools including Westwood Middle School and Temple Baptist Christian School.
Ownership History
Date
Name
Owned For
Owner Type
Purchase Details
Closed on
Sep 3, 2009
Sold by
Bowers Jenny Williams
Bought by
Vance Roger A
Current Estimated Value
Purchase Details
Closed on
Sep 26, 2008
Sold by
Bowers Elizabeth
Bought by
Williams Jenny
Purchase Details
Closed on
Aug 15, 2008
Sold by
Martin Cheryl
Bought by
Williams Jenny
Purchase Details
Closed on
Feb 24, 2005
Sold by
Lohorn Victor
Bought by
Martin Cheryl
Home Financials for this Owner
Home Financials are based on the most recent Mortgage that was taken out on this home.
Original Mortgage
$95,000
Interest Rate
8.3%
Purchase Details
Closed on
Feb 22, 2004
Bought by
Martin Cheryl
Purchase Details
Closed on
Oct 14, 2002
Sold by
Baker Meredith
Bought by
Lohorn Victor and Lohorn Linda
Purchase Details
Closed on
Sep 25, 2002
Sold by
Lowe Jeffrey Scott
Bought by
Neesmith Brenda K
Purchase Details
Closed on
Feb 25, 2002
Sold by
Baker Meredith
Bought by
Lowe Jeffrey Scott
Purchase Details
Closed on
Feb 8, 2002
Sold by
Crosslin Floyd and Crosslin Margaret
Bought by
Baker Meredith
Create a Home Valuation Report for This Property
The Home Valuation Report is an in-depth analysis detailing your home's value as well as a comparison with similar homes in the area
Home Values in the Area
Average Home Value in this Area
Purchase History
| Date | Buyer | Sale Price | Title Company |
|---|---|---|---|
| Vance Roger A | $102,000 | -- | |
| Williams Jenny | -- | -- | |
| Williams Jenny | $119,900 | -- | |
| Martin Cheryl | $100,000 | -- | |
| Martin Cheryl | $100,000 | -- | |
| Lohorn Victor | $77,000 | -- | |
| Neesmith Brenda K | $72,500 | -- | |
| Lowe Jeffrey Scott | $20,000 | -- | |
| Baker Meredith | $10,000 | -- |
Source: Public Records
Mortgage History
| Date | Status | Borrower | Loan Amount |
|---|---|---|---|
| Previous Owner | Baker Meredith | $95,000 |
Source: Public Records
Tax History Compared to Growth
Tax History
| Year | Tax Paid | Tax Assessment Tax Assessment Total Assessment is a certain percentage of the fair market value that is determined by local assessors to be the total taxable value of land and additions on the property. | Land | Improvement |
|---|---|---|---|---|
| 2024 | $1,500 | $35,575 | $3,900 | $31,675 |
| 2023 | $1,500 | $35,575 | $0 | $0 |
| 2022 | $1,291 | $35,575 | $3,900 | $31,675 |
| 2021 | $1,278 | $27,925 | $3,000 | $24,925 |
| 2020 | $1,278 | $27,925 | $3,000 | $24,925 |
| 2019 | $1,278 | $27,925 | $3,000 | $24,925 |
| 2018 | $1,278 | $27,925 | $3,000 | $24,925 |
| 2017 | $1,281 | $24,425 | $3,000 | $21,425 |
| 2016 | $1,281 | $24,425 | $3,000 | $21,425 |
| 2015 | $1,281 | $24,425 | $3,000 | $21,425 |
| 2014 | $1,281 | $24,423 | $0 | $0 |
Source: Public Records
Map
Nearby Homes
- 793 Old Bushy Branch Rd
- 416 Powers Rd
- 602 Johnson St
- 515 Mckellar Dr
- 605 Johnson St
- 627 Ragsdale Rd
- 107 Grace Ct
- 608 Henley St
- 775 Ragsdale Rd
- 412 E Harp St
- 537 Shelton Rd
- 1203 Woodland Dr
- 1005 Thoma St
- 400 S Ramsey St
- 1292 McMinnville Hwy
- 1014 Hills Chapel Rd
- 434 S Ramsey St
- 711 Lowry St
- 709 Mill St
- 902 Mcarthur St
- 641 Old Bushy Branch Rd
- 715 Old Bushy Branch Rd
- 733 Old Bushy Branch Rd
- 747 Old Bushy Branch Rd
- 664 Old Bushy Branch Rd
- 50 Baker St
- 615 Old Bushy Branch Rd
- 678 Old Bushy Branch Rd
- 640 Old Bushy Branch Rd
- 68 Baker St
- 718 Old Bushy Branch Rd
- 622 Old Bushy Branch Rd
- 86 Baker St
- 587 Old Bushy Branch Rd
- 588 Old Bushy Branch Rd
- 51 Baker St
- 815 Old Bushy Branch Rd
- 567 Old Bushy Branch Rd
- 69 Baker St
- 87 Baker St