
Seller's Agent in 2025
Ricardo Belgrave
KELLER WILLIAMS REALTY ATLANTIC SHORE-Northfield
(609) 418-1986
34 Total Sales
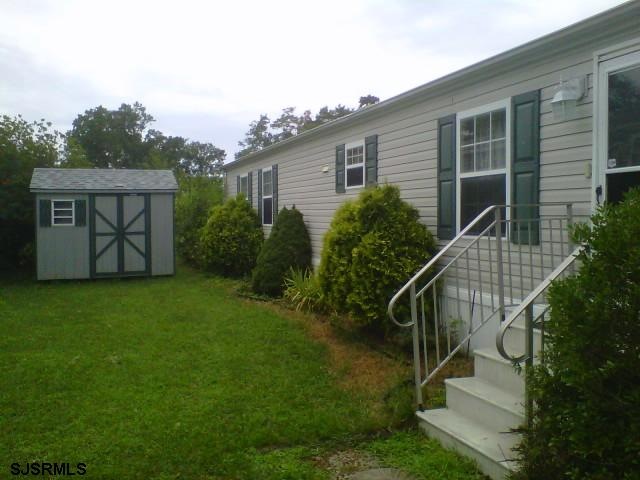
Great unit. 1993 model with master suite with whirlpool tub and shower. Lot rent is 462 for current owner but may be adjusted with new owner.
Last Agent to Sell the Property
CENTURY 21 ATLANTIC PROFESSIONAL REALTY License #9912635 Listed on: 08/01/2012
Last Buyer's Agent
CENTURY 21 ATLANTIC PROFESSIONAL REALTY License #9912635 Listed on: 08/01/2012
Home Type
Est. Annual Taxes
Year Built
Home Design
Interior Spaces
Kitchen
Flooring
Bedrooms and Bathrooms
Laundry
Outdoor Features
Utilities
| Date | Type | Sale Price | Title Company |
|---|---|---|---|
| Deed | $5,350,000 | -- | |
| Bargain Sale Deed | $160,000 | -- |
| Date | Status | Loan Amount | Loan Type |
|---|---|---|---|
| Open | $35,000,000 | Commercial |
| Date | Event | Price | Change | Sq Ft Price |
|---|---|---|---|---|
| 06/17/2025 06/17/25 | Price Changed | $79,000 | -7.1% | -- |
| 05/19/2025 05/19/25 | Price Changed | $84,998 | +7.6% | -- |
| 05/07/2025 05/07/25 | For Sale | $79,000 | -11.2% | -- |
| 04/16/2025 04/16/25 | Price Changed | $89,000 | -6.2% | -- |
| 03/28/2025 03/28/25 | For Sale | $94,900 | 0.0% | -- |
| 03/26/2025 03/26/25 | Off Market | $94,900 | -- | -- |
| 03/03/2025 03/03/25 | For Sale | $94,900 | +26.5% | -- |
| 12/05/2024 12/05/24 | Sold | $75,000 | +30.4% | -- |
| 11/04/2024 11/04/24 | Sold | $57,500 | -28.1% | -- |
| 10/23/2024 10/23/24 | Pending | -- | -- | -- |
| 10/23/2024 10/23/24 | Pending | -- | -- | -- |
| 10/17/2024 10/17/24 | For Sale | $80,000 | +6.7% | -- |
| 06/10/2024 06/10/24 | For Sale | $75,000 | +108.9% | -- |
| 04/27/2022 04/27/22 | Sold | $35,900 | 0.0% | -- |
| 03/18/2022 03/18/22 | Pending | -- | -- | -- |
| 02/17/2022 02/17/22 | Price Changed | $35,900 | -10.0% | -- |
| 02/17/2022 02/17/22 | Price Changed | $39,900 | -11.1% | -- |
| 01/24/2022 01/24/22 | Price Changed | $44,900 | -10.0% | -- |
| 10/01/2021 10/01/21 | For Sale | $49,900 | +117.0% | -- |
| 02/15/2019 02/15/19 | Sold | $23,000 | -39.5% | -- |
| 01/04/2019 01/04/19 | Pending | -- | -- | -- |
| 11/30/2018 11/30/18 | Sold | $38,000 | +102.1% | -- |
| 11/29/2018 11/29/18 | Sold | $18,800 | -24.5% | -- |
| 11/19/2018 11/19/18 | Price Changed | $24,900 | -16.7% | -- |
| 11/14/2018 11/14/18 | Pending | -- | -- | -- |
| 11/06/2018 11/06/18 | Pending | -- | -- | -- |
| 09/24/2018 09/24/18 | Price Changed | $29,900 | -16.7% | -- |
| 08/13/2018 08/13/18 | Price Changed | $35,900 | +80.4% | -- |
| 08/08/2018 08/08/18 | For Sale | $19,900 | -56.3% | -- |
| 07/24/2018 07/24/18 | Price Changed | $45,500 | +21.3% | -- |
| 07/17/2018 07/17/18 | For Sale | $37,500 | +134.4% | -- |
| 06/15/2018 06/15/18 | Sold | $16,000 | -37.3% | -- |
| 06/01/2018 06/01/18 | Sold | $25,500 | +8.5% | -- |
| 05/14/2018 05/14/18 | Pending | -- | -- | -- |
| 05/11/2018 05/11/18 | Sold | $23,500 | -17.5% | -- |
| 05/11/2018 05/11/18 | For Sale | $28,500 | +21.3% | -- |
| 05/10/2018 05/10/18 | Pending | -- | -- | -- |
| 04/29/2018 04/29/18 | Price Changed | $23,500 | -6.0% | -- |
| 04/26/2018 04/26/18 | Price Changed | $25,000 | +4.2% | -- |
| 04/08/2018 04/08/18 | Price Changed | $24,000 | -4.0% | -- |
| 03/16/2018 03/16/18 | For Sale | $25,000 | 0.0% | -- |
| 03/06/2018 03/06/18 | Pending | -- | -- | -- |
| 02/22/2018 02/22/18 | Price Changed | $25,000 | -47.4% | -- |
| 02/16/2018 02/16/18 | For Sale | $47,500 | +82.7% | -- |
| 01/29/2018 01/29/18 | For Sale | $26,000 | +44.4% | -- |
| 10/06/2017 10/06/17 | For Sale | $18,000 | -10.0% | -- |
| 06/10/2016 06/10/16 | Sold | $20,000 | 0.0% | -- |
| 05/02/2016 05/02/16 | Pending | -- | -- | -- |
| 11/10/2015 11/10/15 | For Sale | $20,000 | +5.3% | -- |
| 06/15/2015 06/15/15 | Sold | $19,000 | 0.0% | -- |
| 05/19/2015 05/19/15 | Pending | -- | -- | -- |
| 04/26/2015 04/26/15 | For Sale | $19,000 | -24.0% | -- |
| 07/08/2014 07/08/14 | Sold | $25,000 | +4.2% | -- |
| 07/08/2014 07/08/14 | Pending | -- | -- | -- |
| 07/07/2014 07/07/14 | Sold | $24,000 | +41.2% | -- |
| 07/01/2014 07/01/14 | Pending | -- | -- | -- |
| 03/31/2014 03/31/14 | Sold | $17,000 | -29.2% | -- |
| 03/08/2014 03/08/14 | Pending | -- | -- | -- |
| 02/07/2014 02/07/14 | For Sale | $24,000 | +41.2% | -- |
| 01/02/2014 01/02/14 | For Sale | $17,000 | -32.0% | -- |
| 09/18/2013 09/18/13 | For Sale | $25,000 | +212.5% | -- |
| 05/24/2013 05/24/13 | Sold | $8,000 | 0.0% | -- |
| 05/21/2013 05/21/13 | Pending | -- | -- | -- |
| 03/05/2013 03/05/13 | For Sale | $8,000 | -68.6% | -- |
| 01/31/2013 01/31/13 | Sold | $25,500 | 0.0% | -- |
| 01/16/2013 01/16/13 | Pending | -- | -- | -- |
| 08/01/2012 08/01/12 | For Sale | $25,500 | -- | -- |
| Year | Tax Paid | Tax Assessment Tax Assessment Total Assessment is a certain percentage of the fair market value that is determined by local assessors to be the total taxable value of land and additions on the property. | Land | Improvement |
|---|---|---|---|---|
| 2024 | $76,545 | $2,282,200 | $1,446,000 | $836,200 |
| 2023 | $76,111 | $2,282,200 | $1,446,000 | $836,200 |
| 2022 | $76,111 | $2,282,200 | $1,446,000 | $836,200 |
| 2021 | $76,728 | $2,282,200 | $1,446,000 | $836,200 |
| 2020 | $75,335 | $2,282,200 | $1,446,000 | $836,200 |
| 2019 | $73,281 | $2,282,200 | $1,446,000 | $836,200 |
| 2018 | $71,707 | $2,282,200 | $1,446,000 | $836,200 |
| 2017 | $71,456 | $2,282,200 | $1,446,000 | $836,200 |
| 2016 | $68,626 | $2,282,200 | $1,446,000 | $836,200 |
| 2015 | $67,622 | $2,282,200 | $1,446,000 | $836,200 |
| 2014 | $66,275 | $2,282,200 | $1,446,000 | $836,200 |
Seller's Agent in 2025
Ricardo Belgrave
KELLER WILLIAMS REALTY ATLANTIC SHORE-Northfield
(609) 418-1986
34 Total Sales
L
Seller's Agent in 2025
Lureen Wiggins
BETTER HOMES and GARDENS REAL ESTATE MATURO REALTY-Mays Landing
(443) 600-3280
9 Total Sales
A
Seller's Agent in 2024
Angel Merrill
BHHS Fox & Roach
13 Total Sales
Seller's Agent in 2024
LEIDA BRENES
GRACE PROPERTIES
(609) 703-7541
68 Total Sales
K
Buyer's Agent in 2024
Kathryn Bruce
COLDWELL BANKER ARGUS REAL ESTATE-Northfield
(516) 662-4109
1 Total Sale
Seller's Agent in 2022
Jackie Carney
KELLER WILLIAMS REALTY ATLANTIC SHORE-Northfield
(609) 703-4481
18 Total Sales
Source: South Jersey Shore Regional MLS
MLS Number: 398663
APN: 08-01211-0000-00008
Disclaimer: Certain information contained herein is derived from information provided by parties other than Homes.com. All information provided is deemed reliable, but is not guaranteed to be accurate and should be independently verified.
![]() IDX information is provided exclusively for personal, non-commercial use, and may not be used for any purpose other than to identify prospective properties consumers may be interested in purchasing.
IDX information is provided exclusively for personal, non-commercial use, and may not be used for any purpose other than to identify prospective properties consumers may be interested in purchasing.
Information is deemed reliable but not guaranteed.
© 2025 South Jersey Shore Regional Multiple Listing Service. All rights reserved.