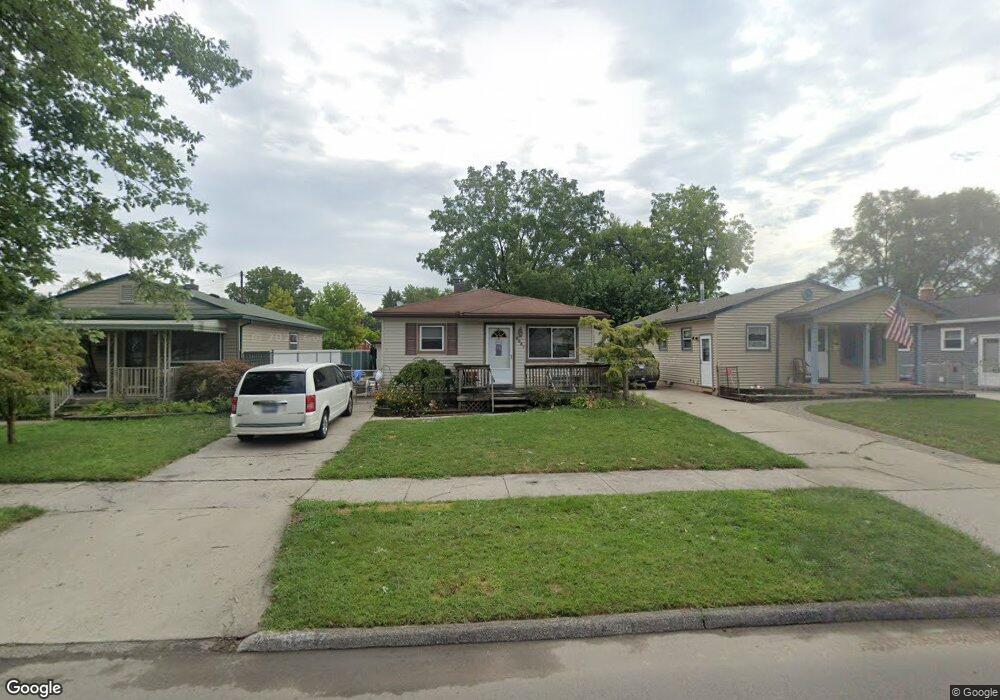
6657 Oak St Taylor, MI 48180
Estimated Value: $131,000 - $170,000
3
Beds
1
Bath
864
Sq Ft
$183/Sq Ft
Est. Value
About This Home
This home is located at 6657 Oak St, Taylor, MI 48180 and is currently estimated at $157,817, approximately $182 per square foot. 6657 Oak St is a home located in Wayne County with nearby schools including Clarence Randall Elementary School, Hoover Middle School, and Quest Charter Academy.
Ownership History
Date
Name
Owned For
Owner Type
Purchase Details
Closed on
Feb 23, 2009
Sold by
Secretary Of Housing & Urban Development
Bought by
Murray James
Current Estimated Value
Purchase Details
Closed on
Dec 6, 2007
Sold by
Gmac Mortgage Llc
Bought by
Hud
Purchase Details
Closed on
Nov 14, 2007
Sold by
Johnson Jason and Johnson Stacey
Bought by
Mortgage Electronic Registration Systems
Purchase Details
Closed on
Jun 28, 2004
Sold by
Durham Perry and Durham Bonita
Bought by
Johnson Jason
Create a Home Valuation Report for This Property
The Home Valuation Report is an in-depth analysis detailing your home's value as well as a comparison with similar homes in the area
Home Values in the Area
Average Home Value in this Area
Purchase History
| Date | Buyer | Sale Price | Title Company |
|---|---|---|---|
| Murray James | $32,000 | None Available | |
| Hud | -- | None Available | |
| Gmac Mortgage Llc | -- | None Available | |
| Mortgage Electronic Registration Systems | $130,574 | None Available | |
| Johnson Jason | $119,300 | Metropolitan Title Company |
Source: Public Records
Tax History
| Year | Tax Paid | Tax Assessment Tax Assessment Total Assessment is a certain percentage of the fair market value that is determined by local assessors to be the total taxable value of land and additions on the property. | Land | Improvement |
|---|---|---|---|---|
| 2025 | $1,411 | $74,700 | $0 | $0 |
| 2024 | $1,366 | $65,700 | $0 | $0 |
| 2023 | $2,799 | $58,200 | $0 | $0 |
| 2022 | $1,304 | $51,800 | $0 | $0 |
| 2021 | $2,402 | $46,700 | $0 | $0 |
| 2020 | $2,262 | $42,800 | $0 | $0 |
| 2019 | $206,058 | $35,200 | $0 | $0 |
| 2018 | $1,120 | $27,800 | $0 | $0 |
| 2017 | $2,864 | $28,300 | $0 | $0 |
| 2016 | $1,589 | $27,500 | $0 | $0 |
| 2015 | $2,530 | $25,300 | $0 | $0 |
| 2013 | $2,570 | $26,700 | $0 | $0 |
| 2012 | $1,145 | $26,000 | $7,300 | $18,700 |
Source: Public Records
Map
Nearby Homes
- 6587 Elm St
- 6753 Madison St
- 6456 Birch St
- 6606 Cornell St
- 6864 Cornell St
- 7166 Pardee Rd
- 6784 Cooper St
- 6550 Buck St
- 7912 Pine St
- 6420 Burr St
- 6605 Bailey St
- 6042 Banner St
- 5871 Cooper St
- 5952 Banner St
- 5689 Cornell St
- 5578 Grindley Park St
- 22931 Champaign St
- 5880 Burr St
- 7521 Katherine St
- 8279 Elm St
Your Personal Tour Guide
Ask me questions while you tour the home.