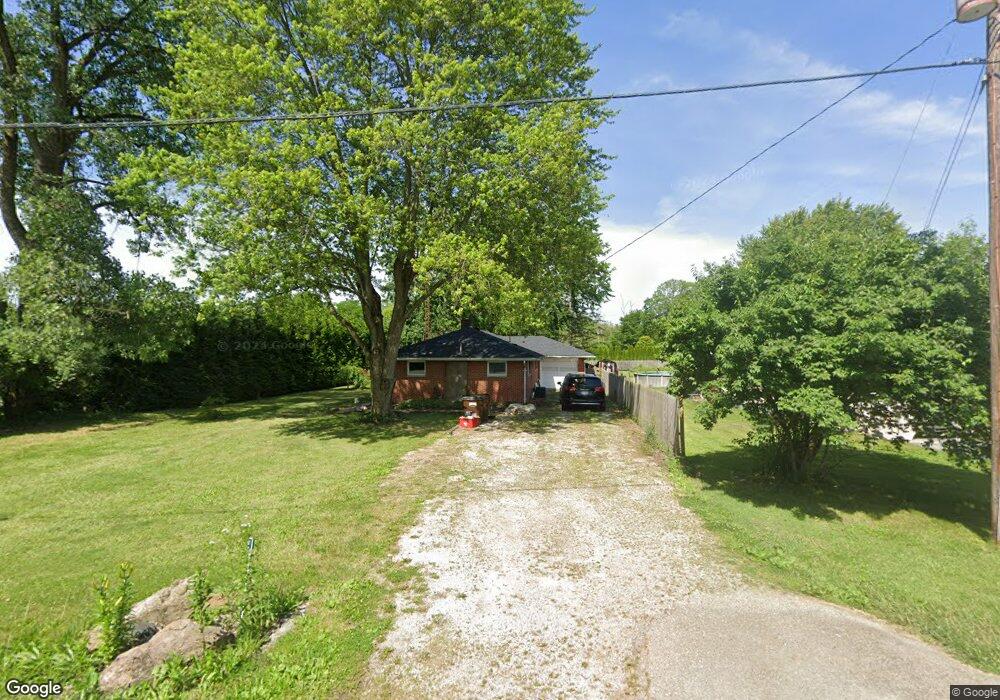
6658 Clark Rd Arcanum, OH 45304
Estimated Value: $136,000 - $216,000
3
Beds
1
Bath
1,302
Sq Ft
$129/Sq Ft
Est. Value
About This Home
This home is located at 6658 Clark Rd, Arcanum, OH 45304 and is currently estimated at $168,398, approximately $129 per square foot. 6658 Clark Rd is a home located in Darke County with nearby schools including Arcanum Elementary School, Butler Middle School, and Arcanum High School.
Ownership History
Date
Name
Owned For
Owner Type
Purchase Details
Closed on
May 7, 2024
Sold by
Suggs Jennifer R and Weaver Jennifer R
Bought by
Croft Daniel K and Croft Ashleigh
Current Estimated Value
Home Financials for this Owner
Home Financials are based on the most recent Mortgage that was taken out on this home.
Original Mortgage
$166,666
Outstanding Balance
$163,518
Interest Rate
6.82%
Mortgage Type
New Conventional
Estimated Equity
$4,880
Purchase Details
Closed on
Oct 22, 2020
Sold by
Ernst Martin L
Bought by
Weaver Jennifer R and Sugos Jennifer R
Purchase Details
Closed on
Jul 31, 2012
Sold by
Morrow Catharine A
Bought by
Ernst Martin L
Home Financials for this Owner
Home Financials are based on the most recent Mortgage that was taken out on this home.
Original Mortgage
$46,148
Interest Rate
4.4%
Mortgage Type
FHA
Purchase Details
Closed on
Aug 19, 2011
Sold by
Estate Of Maurice M Morrow
Bought by
Morrow Frances J
Create a Home Valuation Report for This Property
The Home Valuation Report is an in-depth analysis detailing your home's value as well as a comparison with similar homes in the area
Purchase History
| Date | Buyer | Sale Price | Title Company |
|---|---|---|---|
| Croft Daniel K | $165,000 | None Listed On Document | |
| Weaver Jennifer R | $85,000 | None Available | |
| Ernst Martin L | $47,000 | None Available | |
| Morrow Frances J | -- | None Available |
Source: Public Records
Mortgage History
| Date | Status | Borrower | Loan Amount |
|---|---|---|---|
| Open | Croft Daniel K | $166,666 | |
| Previous Owner | Ernst Martin L | $46,148 |
Source: Public Records
Tax History
| Year | Tax Paid | Tax Assessment Tax Assessment Total Assessment is a certain percentage of the fair market value that is determined by local assessors to be the total taxable value of land and additions on the property. | Land | Improvement |
|---|---|---|---|---|
| 2025 | $1,368 | $54,650 | $8,020 | $46,630 |
| 2024 | $1,368 | $39,460 | $8,020 | $31,440 |
| 2023 | $1,390 | $40,040 | $8,600 | $31,440 |
| 2022 | $1,430 | $37,040 | $7,290 | $29,750 |
| 2021 | $1,442 | $37,040 | $7,290 | $29,750 |
| 2020 | $1,397 | $37,040 | $7,290 | $29,750 |
| 2019 | $1,208 | $32,080 | $7,290 | $24,790 |
| 2018 | $1,199 | $32,080 | $7,290 | $24,790 |
| 2017 | $1,156 | $32,080 | $7,290 | $24,790 |
| 2016 | $1,157 | $32,710 | $6,840 | $25,870 |
| 2015 | $1,157 | $32,710 | $6,840 | $25,870 |
| 2014 | $1,172 | $32,710 | $6,840 | $25,870 |
| 2013 | $1,138 | $30,080 | $6,560 | $23,520 |
Source: Public Records
Map
Nearby Homes
- 0 Ohio 722 Unit 10052561
- 0 Ohio 722 Unit 949232
- 0 Ohio 722 Unit 1042963
- 0 Friday Rd
- 6614 Otterbein Ithaca Rd
- 405 East St
- 1893 Gordon Landis Rd
- 6051 Sonora Rd
- 404 W 1st St
- 246 N Main St
- 210 E South St
- 2 N Main St
- 206 W George St
- 201 W George St
- 111 N Main St
- 4790 Grubbs Rex Rd
- 217 Orchard St
- 408 N Main St
- 210 High St
- 10738 Preble County Line Rd
Your Personal Tour Guide
Ask me questions while you tour the home.