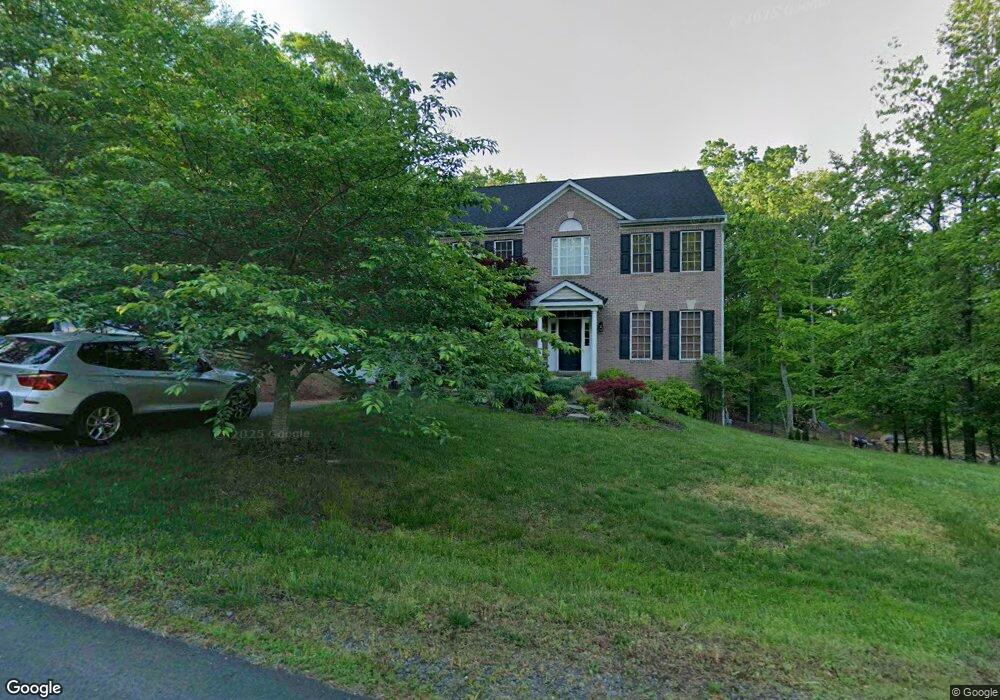
6661 Deep Hollow Ln Manassas, VA 20112
South Manassas NeighborhoodEstimated Value: $809,691 - $844,000
4
Beds
4
Baths
2,910
Sq Ft
$285/Sq Ft
Est. Value
About This Home
This home is located at 6661 Deep Hollow Ln, Manassas, VA 20112 and is currently estimated at $828,423, approximately $284 per square foot. 6661 Deep Hollow Ln is a home located in Prince William County with nearby schools including Signal Hill Elementary School, Parkside Middle School, and Osbourn Park High School.
Ownership History
Date
Name
Owned For
Owner Type
Purchase Details
Closed on
Oct 22, 2021
Sold by
Mcallister Andrew and Mcallister Houry
Bought by
Mcallister Andrew
Current Estimated Value
Home Financials for this Owner
Home Financials are based on the most recent Mortgage that was taken out on this home.
Original Mortgage
$408,000
Outstanding Balance
$313,636
Interest Rate
2.12%
Mortgage Type
New Conventional
Estimated Equity
$514,787
Purchase Details
Closed on
Aug 1, 2001
Sold by
Prospect Dev Co Inc
Bought by
Mcallister Andrew
Home Financials for this Owner
Home Financials are based on the most recent Mortgage that was taken out on this home.
Original Mortgage
$275,000
Interest Rate
7.14%
Purchase Details
Closed on
Feb 26, 2001
Sold by
Hunters Ridge-Treywood L
Bought by
Prospect Dev Co Inc
Create a Home Valuation Report for This Property
The Home Valuation Report is an in-depth analysis detailing your home's value as well as a comparison with similar homes in the area
Home Values in the Area
Average Home Value in this Area
Purchase History
| Date | Buyer | Sale Price | Title Company |
|---|---|---|---|
| Mcallister Andrew | -- | Accommodation | |
| Mcallister Andrew | $354,940 | -- | |
| Prospect Dev Co Inc | $150,000 | -- |
Source: Public Records
Mortgage History
| Date | Status | Borrower | Loan Amount |
|---|---|---|---|
| Open | Mcallister Andrew | $408,000 | |
| Previous Owner | Mcallister Andrew | $275,000 |
Source: Public Records
Tax History Compared to Growth
Tax History
| Year | Tax Paid | Tax Assessment Tax Assessment Total Assessment is a certain percentage of the fair market value that is determined by local assessors to be the total taxable value of land and additions on the property. | Land | Improvement |
|---|---|---|---|---|
| 2025 | $6,781 | $733,500 | $229,400 | $504,100 |
| 2024 | $6,781 | $681,900 | $212,100 | $469,800 |
| 2023 | $6,789 | $652,500 | $197,900 | $454,600 |
| 2022 | $6,955 | $617,700 | $191,200 | $426,500 |
| 2021 | $6,881 | $565,500 | $191,200 | $374,300 |
| 2020 | $8,389 | $541,200 | $182,600 | $358,600 |
| 2019 | $7,838 | $505,700 | $177,500 | $328,200 |
| 2018 | $6,066 | $502,400 | $180,600 | $321,800 |
| 2017 | $6,291 | $512,300 | $183,600 | $328,700 |
| 2016 | $6,542 | $538,300 | $192,800 | $345,500 |
| 2015 | $6,237 | $523,900 | $188,700 | $335,200 |
| 2014 | $6,237 | $501,900 | $194,800 | $307,100 |
Source: Public Records
Map
Nearby Homes
- 11175 Stonebrook Dr
- Monticello Plan at Whispering Dove Estates
- 6171 Hemlock Ct
- 11021 Winding Brook Ct
- 12357 Purcell Rd
- 6047 Greenway Ct
- 11520 Moore Dr
- 7554 Knightshayes Dr
- 10823 Moore Dr
- 10940 Meanderview Ct
- 7124 Dark Forest Dr
- 12704 Purcell Rd
- 6233 Alistair Dr
- 7316 Mariposa Dr
- 12607 Byrne Place
- 7414 Silent Willow Ct
- 10729 River Run Dr
- 11049 Newood Dr
- 7217 Ridgeway Dr
- 10696 Moore Dr
- 6651 Deep Hollow Ln
- 6660 Deep Hollow Ln
- 6671 Deep Hollow Ln
- 6641 Deep Hollow Ln
- 6670 Deep Hollow Ln
- 6681 Deep Hollow Ln
- 6631 Deep Hollow Ln Unit 101
- 6650 Deep Hollow Ln
- 6691 Deep Hollow Ln
- 6621 Deep Hollow Ln
- 6680 Deep Hollow Ln
- 6610 Deep Hollow Ln
- 6611 Deep Hollow Ln
- 6195 River Forest Dr
- 6601 Deep Hollow Ln
- 11780 Fingerlake Way
- 6191 River Forest Dr
- 6700 Hunters Ridge Rd
- 6660 Hunters Ridge Rd