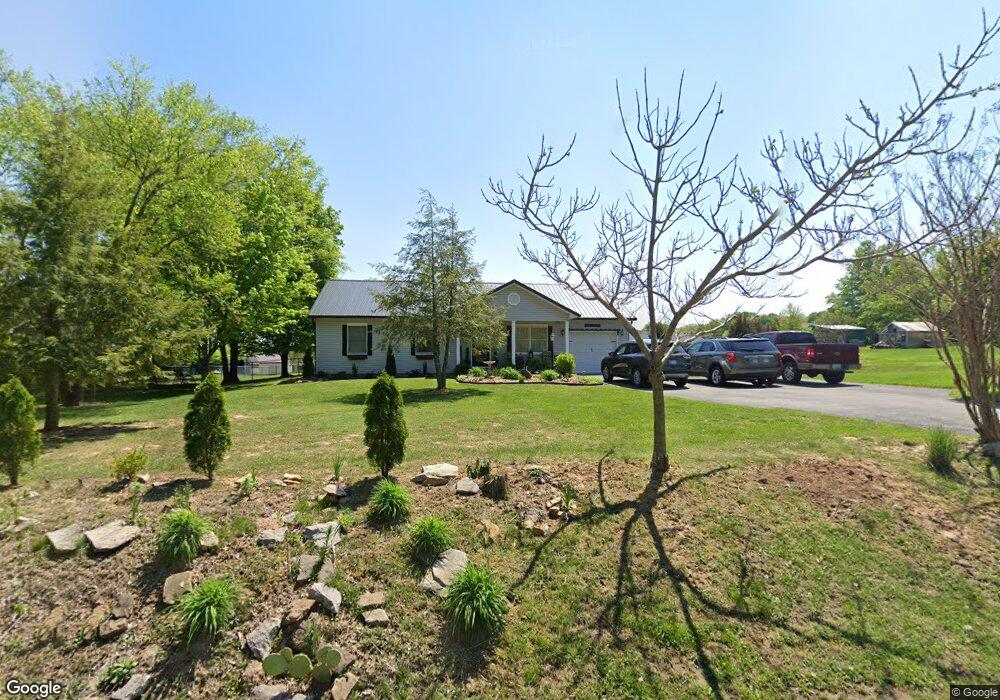
6663 Frank Ott Rd Georgetown, IN 47122
Estimated Value: $260,669 - $291,000
3
Beds
2
Baths
1,176
Sq Ft
$235/Sq Ft
Est. Value
About This Home
This home is located at 6663 Frank Ott Rd, Georgetown, IN 47122 and is currently estimated at $276,417, approximately $235 per square foot. 6663 Frank Ott Rd is a home located in Floyd County with nearby schools including Georgetown Elementary School, Highland Hills Middle School, and Floyd Central High School.
Ownership History
Date
Name
Owned For
Owner Type
Purchase Details
Closed on
Apr 1, 2022
Sold by
Unknown
Bought by
Joseph Jeffery T
Current Estimated Value
Home Financials for this Owner
Home Financials are based on the most recent Mortgage that was taken out on this home.
Original Mortgage
$90,500
Outstanding Balance
$74,194
Interest Rate
3.83%
Mortgage Type
New Conventional
Estimated Equity
$202,223
Purchase Details
Closed on
Sep 9, 2011
Sold by
Chandler Roberter and Chandler Paula B
Bought by
Joseph Jeffery T
Purchase Details
Closed on
Dec 8, 2010
Sold by
Hsbc Bank Usa Na
Bought by
Chandler Robert L and Chandler Paula B
Purchase Details
Closed on
Jul 27, 2010
Sold by
Wilson Katina S and Wilson Jeffrey
Bought by
Hsbc Bank Usa Na
Purchase Details
Closed on
Oct 16, 2006
Sold by
Butrum Robert L and Butrum Patrice S
Bought by
Wilson Jeffrey and Wilson Katina S
Home Financials for this Owner
Home Financials are based on the most recent Mortgage that was taken out on this home.
Original Mortgage
$126,825
Interest Rate
7.72%
Mortgage Type
Assumption
Create a Home Valuation Report for This Property
The Home Valuation Report is an in-depth analysis detailing your home's value as well as a comparison with similar homes in the area
Home Values in the Area
Average Home Value in this Area
Purchase History
| Date | Buyer | Sale Price | Title Company |
|---|---|---|---|
| Joseph Jeffery T | -- | None Listed On Document | |
| Joseph Jeffery T | -- | None Available | |
| Chandler Robert L | $80,500 | None Available | |
| Hsbc Bank Usa Na | $145,287 | None Available | |
| Wilson Jeffrey | -- | Executive Title Company |
Source: Public Records
Mortgage History
| Date | Status | Borrower | Loan Amount |
|---|---|---|---|
| Open | Joseph Jeffery T | $90,500 | |
| Previous Owner | Wilson Jeffrey | $126,825 |
Source: Public Records
Tax History Compared to Growth
Tax History
| Year | Tax Paid | Tax Assessment Tax Assessment Total Assessment is a certain percentage of the fair market value that is determined by local assessors to be the total taxable value of land and additions on the property. | Land | Improvement |
|---|---|---|---|---|
| 2024 | $1,539 | $205,400 | $39,700 | $165,700 |
| 2023 | $1,453 | $190,300 | $39,700 | $150,600 |
| 2022 | $1,286 | $170,400 | $39,700 | $130,700 |
| 2021 | $1,150 | $157,700 | $39,700 | $118,000 |
| 2020 | $1,071 | $148,600 | $39,700 | $108,900 |
| 2019 | $1,043 | $149,100 | $39,700 | $109,400 |
| 2018 | $850 | $131,600 | $39,700 | $91,900 |
| 2017 | $948 | $132,500 | $39,700 | $92,800 |
| 2016 | $893 | $134,000 | $39,700 | $94,300 |
| 2014 | $737 | $115,700 | $39,700 | $76,000 |
| 2013 | -- | $110,000 | $39,700 | $70,300 |
Source: Public Records
Map
Nearby Homes
- 8164- LOT 932 Zelpha Blvd
- 9032- LOT 912 Haylyn Ln
- Finch Bonus Plan at Knob Hill
- Haylyn 48' Plan at Knob Hill
- Model A Plan at Knob Hill
- Anniston Plan at Knob Hill
- Haylyn Plan at Knob Hill
- Maria Plan at Knob Hill
- Samantha Bonus Plan at Knob Hill
- Juliana Plan at Knob Hill
- Samantha Plan at Knob Hill
- Model F Plan at Knob Hill
- Juliana Bonus Plan at Knob Hill
- Finch Plan at Knob Hill
- Hadley Plan at Knob Hill
- Winnipeg Plan at Knob Hill
- Nichole Plan at Knob Hill
- Model B Plan at Knob Hill
- Model E Plan at Knob Hill
- Model J Plan at Knob Hill
- 6661 Frank Ott Rd
- 6719 Frank Ott Rd
- 6651 Frank Ott Rd
- 6012 Rising Fawn Ct
- 6658 Frank Ott Rd
- 6010 Rising Fawn Ct
- 6008 Rising Fawn Ct
- 6730 Frank Ott Rd
- 6771 Frank Ott Rd
- 6014 Rising Fawn Ct
- 6006 Rising Fawn Ct
- 6004 Rising Fawn Ct
- 6605 Frank Ott Rd
- 6766 Frank Ott Rd
- 1827 Oakes Rd
- 6016 Rising Fawn Ct
- 6811 Frank Ott Rd
- 6013 Rising Fawn Ct
- 1985 Edwardsville Galena Rd
- 6018 Rising Fawn Ct