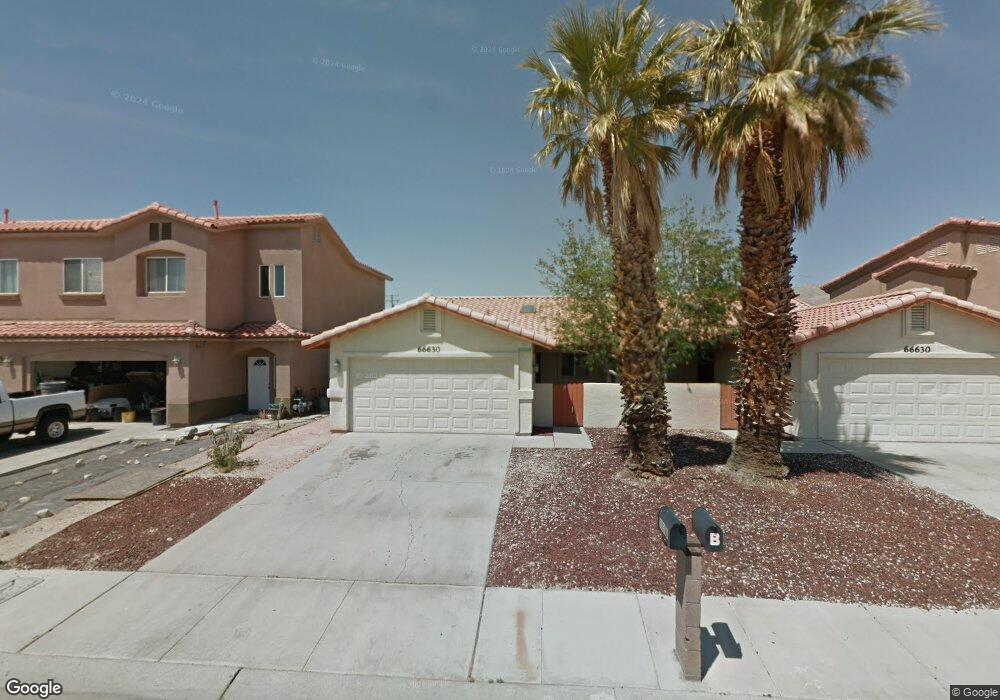
66630 Mesquite Ave Desert Hot Springs, CA 92240
Estimated Value: $384,000 - $497,000
4
Beds
2
Baths
2,512
Sq Ft
$172/Sq Ft
Est. Value
About This Home
This home is located at 66630 Mesquite Ave, Desert Hot Springs, CA 92240 and is currently estimated at $431,667, approximately $171 per square foot. 66630 Mesquite Ave is a home located in Riverside County with nearby schools including Cabot Yerxa Elementary School, Desert Springs Middle School, and Desert Hot Springs High School.
Ownership History
Date
Name
Owned For
Owner Type
Purchase Details
Closed on
May 11, 2010
Sold by
U S Bank National Association
Bought by
Verdugo Edward A
Current Estimated Value
Purchase Details
Closed on
Apr 13, 2010
Sold by
Us Bank Na
Bought by
U S Bank National Association
Purchase Details
Closed on
Feb 16, 2010
Sold by
Soong Joyce
Bought by
Us Bank Na
Purchase Details
Closed on
Jan 11, 2006
Sold by
Soong Joyce and Soong Joyce H H
Bought by
Soong Joyce
Purchase Details
Closed on
Dec 17, 2003
Sold by
Biagiotti Guy A
Bought by
Soong Joyce H H
Home Financials for this Owner
Home Financials are based on the most recent Mortgage that was taken out on this home.
Original Mortgage
$188,000
Interest Rate
6.75%
Mortgage Type
Commercial
Create a Home Valuation Report for This Property
The Home Valuation Report is an in-depth analysis detailing your home's value as well as a comparison with similar homes in the area
Home Values in the Area
Average Home Value in this Area
Purchase History
| Date | Buyer | Sale Price | Title Company |
|---|---|---|---|
| Verdugo Edward A | $96,000 | Chicago Title Company | |
| U S Bank National Association | -- | Chicago Title Company | |
| Us Bank Na | $90,000 | Servicelink | |
| Soong Joyce | -- | Diversified Title & Escrow S | |
| Soong Joyce | -- | Diversified Title & Escrow S | |
| Soong Joyce H H | $235,000 | Commerce Title Company |
Source: Public Records
Mortgage History
| Date | Status | Borrower | Loan Amount |
|---|---|---|---|
| Previous Owner | Soong Joyce H H | $188,000 |
Source: Public Records
Tax History Compared to Growth
Tax History
| Year | Tax Paid | Tax Assessment Tax Assessment Total Assessment is a certain percentage of the fair market value that is determined by local assessors to be the total taxable value of land and additions on the property. | Land | Improvement |
|---|---|---|---|---|
| 2025 | $3,894 | $236,755 | $23,674 | $213,081 |
| 2023 | $3,894 | $227,562 | $22,755 | $204,807 |
| 2022 | $3,942 | $223,101 | $22,309 | $200,792 |
| 2021 | $3,877 | $218,727 | $21,872 | $196,855 |
| 2020 | $3,742 | $216,485 | $21,648 | $194,837 |
| 2019 | $3,685 | $212,241 | $21,224 | $191,017 |
| 2018 | $3,589 | $208,080 | $20,808 | $187,272 |
| 2017 | $3,489 | $204,000 | $20,400 | $183,600 |
| 2016 | $2,153 | $104,670 | $10,899 | $93,771 |
| 2015 | $1,455 | $103,099 | $10,736 | $92,363 |
| 2014 | $1,435 | $101,081 | $10,527 | $90,554 |
Source: Public Records
Map
Nearby Homes
- 1 Joseph Way
- 2 Joseph Way
- 13704 Sarita Dr
- 66590 Joseph Way
- 0 Joseph Way Unit 219122901DA
- 0 Redbud Unit IV25192756
- 13405 Ocotillo Rd
- 0 Linteau Ln Unit 219131666DA
- 13547 Caliente Dr
- 13834 Cactus Dr
- 66792 Hacienda Ave
- 66765 Granada Ave
- 12340 Cactus Dr
- 66208 Palo Verde Trail
- 0 Ocotillo & Flora St Unit 219137167PS
- 13423 Ramona Dr
- 14777 Palm Dr Unit 35
- 14777 Palm Dr Unit 113
- 14777 Palm Dr Unit 157
- 14777 Palm Dr Unit 124
- 66630 Mesquite Ave Unit A
- 66632 Mesquite Ave
- 66650 Mesquite Ave
- 13735 Richard Way Unit A
- 13735 Richard Way
- 66635 Mesquite Ave
- 0 Richard Way Unit 13-695403PS
- 0 Richard Way Unit 14-811221PS
- 0 Richard Way Unit 13695403DA
- 0 Richard Way Unit 21472540DA
- 0 Richard Way Unit 14811221DA
- 13725 Richard Way
- 66625 Mesquite Ave
- 13800 Susan Way
- 13745 Richard Way
- 13900 Susan Way
- 66665 Mesquite Ave
- Xxxx Susan Way
- 66670 Two Bunch Palms Trail
- 66660 Two Bunch Palms Trail