6664 N Long Lake Rd Chisholm, MN 55719
Estimated Value: $329,000 - $573,000
3
Beds
2
Baths
2,001
Sq Ft
$229/Sq Ft
Est. Value
About This Home
This home is located at 6664 N Long Lake Rd, Chisholm, MN 55719 and is currently estimated at $458,112, approximately $228 per square foot. 6664 N Long Lake Rd is a home located in St. Louis County with nearby schools including Vaughan Elementary School, Chisholm Elementary School, and Chisholm Secondary School.
Ownership History
Date
Name
Owned For
Owner Type
Purchase Details
Closed on
May 9, 2019
Sold by
Gabardi Gene E and Schafer Shelley A
Bought by
Gabardi Gene E and Schafer Shelley A
Current Estimated Value
Home Financials for this Owner
Home Financials are based on the most recent Mortgage that was taken out on this home.
Original Mortgage
$241,000
Outstanding Balance
$155,612
Interest Rate
4.1%
Mortgage Type
New Conventional
Estimated Equity
$302,500
Purchase Details
Closed on
Jun 29, 2009
Sold by
Gabardi Gene E
Bought by
Gabardi Gene E and Schafer Shelley A
Home Financials for this Owner
Home Financials are based on the most recent Mortgage that was taken out on this home.
Original Mortgage
$234,000
Interest Rate
4.94%
Mortgage Type
Purchase Money Mortgage
Purchase Details
Closed on
Apr 7, 2009
Sold by
Kniffin Lisa M and Gabardi Lisa M
Bought by
Gabardi Gene E
Create a Home Valuation Report for This Property
The Home Valuation Report is an in-depth analysis detailing your home's value as well as a comparison with similar homes in the area
Home Values in the Area
Average Home Value in this Area
Purchase History
| Date | Buyer | Sale Price | Title Company |
|---|---|---|---|
| Gabardi Gene E | -- | All American Title Co Inc | |
| Gabardi Gene E | -- | All American Title Co Inc | |
| Gabardi Gene E | -- | None Available |
Source: Public Records
Mortgage History
| Date | Status | Borrower | Loan Amount |
|---|---|---|---|
| Open | Gabardi Gene E | $241,000 | |
| Closed | Gabardi Gene E | $234,000 |
Source: Public Records
Tax History Compared to Growth
Tax History
| Year | Tax Paid | Tax Assessment Tax Assessment Total Assessment is a certain percentage of the fair market value that is determined by local assessors to be the total taxable value of land and additions on the property. | Land | Improvement |
|---|---|---|---|---|
| 2024 | $4,668 | $378,800 | $96,300 | $282,500 |
| 2023 | $4,668 | $354,200 | $88,000 | $266,200 |
| 2022 | $4,210 | $311,100 | $75,500 | $235,600 |
| 2021 | $3,066 | $249,500 | $65,100 | $184,400 |
| 2020 | $2,910 | $249,500 | $65,100 | $184,400 |
| 2019 | $3,052 | $249,500 | $65,100 | $184,400 |
| 2018 | $2,990 | $249,500 | $65,100 | $184,400 |
| 2017 | $2,582 | $249,400 | $65,000 | $184,400 |
| 2016 | $2,644 | $231,500 | $65,000 | $166,500 |
| 2015 | $3,040 | $215,100 | $60,400 | $154,700 |
| 2014 | $3,040 | $215,100 | $60,400 | $154,700 |
Source: Public Records
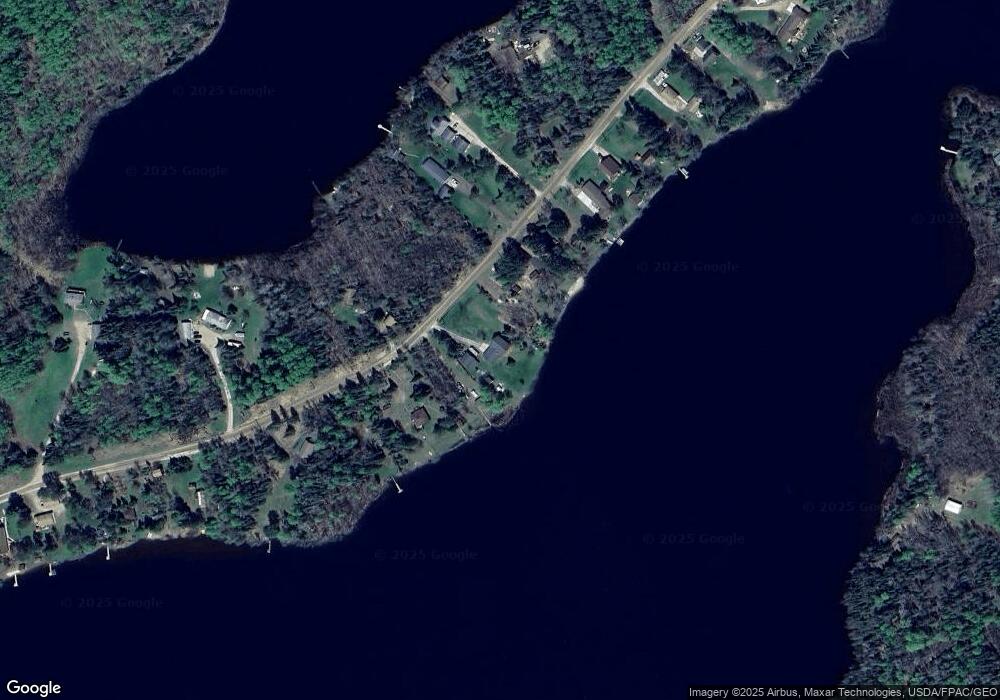
Map
Nearby Homes
- 6592 Dewey Point Rd
- 11452 Cooper Rd
- 6821 Barrett Rd
- TBD NE 3rd St
- TBD French Rd
- Tbd French Rd Unit LotWP001
- 808 Center Dr NW
- 609 8th St NW
- 500 10th Ave NW
- 600 4th St NW
- 514 4th St NW
- 757 3rd St NW
- 217 3rd Ave NW
- 225 1st St SW
- 126 2nd St SW
- 13 1st St SW
- 22 3rd St SW
- 25 3rd St SW
- 16 4th St SW
- 17 3rd St SE
- 6666 N Long Lake Rd
- 6662 N Long Lake Rd
- 6660 N Long Lake Rd
- 6670 N Long Lake Rd
- 6672 N Long Lake Rd
- 6672 N Long Lake Rd
- 6661 N Long Lake Rd
- 6667 N Long Lake Rd
- 6669 N Long Lake Rd
- 6673 N Long Lake Rd
- 6676 N Long Lake Rd
- 6654 N Long Lake Rd
- 6677 N Long Lake Rd
- 6678 N Long Lake Rd
- 6653 N Long Lake Rd
- 6680 N Long Lake Rd
- 6650 N Long Lake Rd
- 6682 N Long Lake Rd
- 6648 N Long Lake Rd
- 6685 N Long Lake Rd