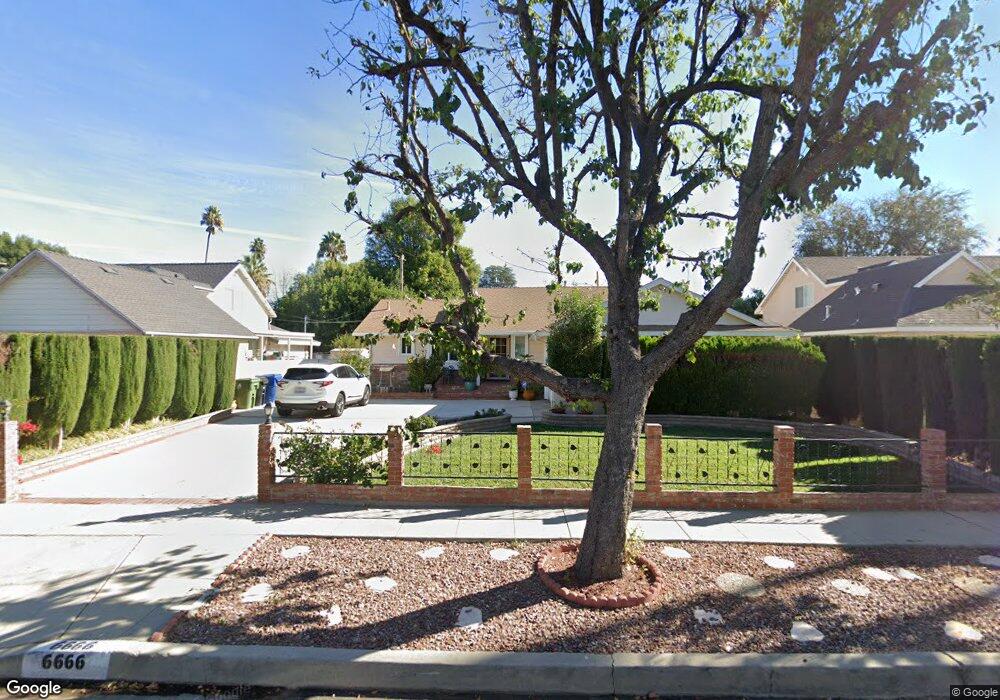
6666 Sedan Ave West Hills, CA 91307
Estimated Value: $932,009 - $1,058,000
4
Beds
2
Baths
1,634
Sq Ft
$617/Sq Ft
Est. Value
About This Home
This home is located at 6666 Sedan Ave, West Hills, CA 91307 and is currently estimated at $1,008,502, approximately $617 per square foot. 6666 Sedan Ave is a home located in Los Angeles County with nearby schools including Hamlin Charter Academy, Woodlake Elementary Community Charter, and Enadia Way Technology Charter.
Ownership History
Date
Name
Owned For
Owner Type
Purchase Details
Closed on
Jul 30, 2024
Sold by
Ronald R Consoli Separate Property Trust and Consoli Kathy V
Bought by
Consoli Kathy V
Current Estimated Value
Purchase Details
Closed on
Oct 18, 2013
Sold by
Consoli Ronald Robert
Bought by
Consoli Ronald R and The Ronald R Consoli Separate Property T
Purchase Details
Closed on
May 21, 2009
Sold by
Vanconsoli Kathy
Bought by
Consoli Ronald Robert
Home Financials for this Owner
Home Financials are based on the most recent Mortgage that was taken out on this home.
Original Mortgage
$272,000
Interest Rate
4.8%
Mortgage Type
New Conventional
Purchase Details
Closed on
Nov 17, 2000
Sold by
Consoli Pamela M
Bought by
Consoli Ronald Robert
Home Financials for this Owner
Home Financials are based on the most recent Mortgage that was taken out on this home.
Original Mortgage
$242,000
Interest Rate
7.86%
Create a Home Valuation Report for This Property
The Home Valuation Report is an in-depth analysis detailing your home's value as well as a comparison with similar homes in the area
Home Values in the Area
Average Home Value in this Area
Purchase History
| Date | Buyer | Sale Price | Title Company |
|---|---|---|---|
| Consoli Kathy V | -- | None Listed On Document | |
| Consoli Ronald R | -- | None Available | |
| Consoli Ronald Robert | -- | Chicago Title Company | |
| Consoli Ronald Robert | -- | American Title Co |
Source: Public Records
Mortgage History
| Date | Status | Borrower | Loan Amount |
|---|---|---|---|
| Previous Owner | Consoli Ronald Robert | $272,000 | |
| Previous Owner | Consoli Ronald Robert | $242,000 |
Source: Public Records
Tax History Compared to Growth
Tax History
| Year | Tax Paid | Tax Assessment Tax Assessment Total Assessment is a certain percentage of the fair market value that is determined by local assessors to be the total taxable value of land and additions on the property. | Land | Improvement |
|---|---|---|---|---|
| 2025 | $3,657 | $283,055 | $113,215 | $169,840 |
| 2024 | $3,657 | $277,506 | $110,996 | $166,510 |
| 2023 | $3,591 | $272,066 | $108,820 | $163,246 |
| 2022 | $3,433 | $266,733 | $106,687 | $160,046 |
| 2021 | $3,384 | $261,504 | $104,596 | $156,908 |
| 2019 | $3,287 | $253,750 | $101,495 | $152,255 |
| 2018 | $3,151 | $248,775 | $99,505 | $149,270 |
| 2016 | $2,997 | $239,117 | $95,642 | $143,475 |
| 2015 | $2,955 | $235,526 | $94,206 | $141,320 |
| 2014 | $2,971 | $230,913 | $92,361 | $138,552 |
Source: Public Records
Map
Nearby Homes
- 23026 Mobile St
- 6814 Berquist Ave
- 23320 Bassett St
- 23036 Victory Blvd
- 23238 Victory Blvd
- 23335 Schoolcraft St
- 22625 Kittridge St
- 22709 Schoolcraft St
- 22612 Kittridge St
- 7101 Fallbrook Ave
- 6655 Sale Ave
- 7151 Atheling Way
- 22630 Gilmore St
- 6650 Sale Ave
- 6820 Gross Ave
- 22835 Styles St
- 6201 Melba Ave
- 7017 Vicky Ave
- 23432 Victory Blvd
- 6243 Fallbrook Ave