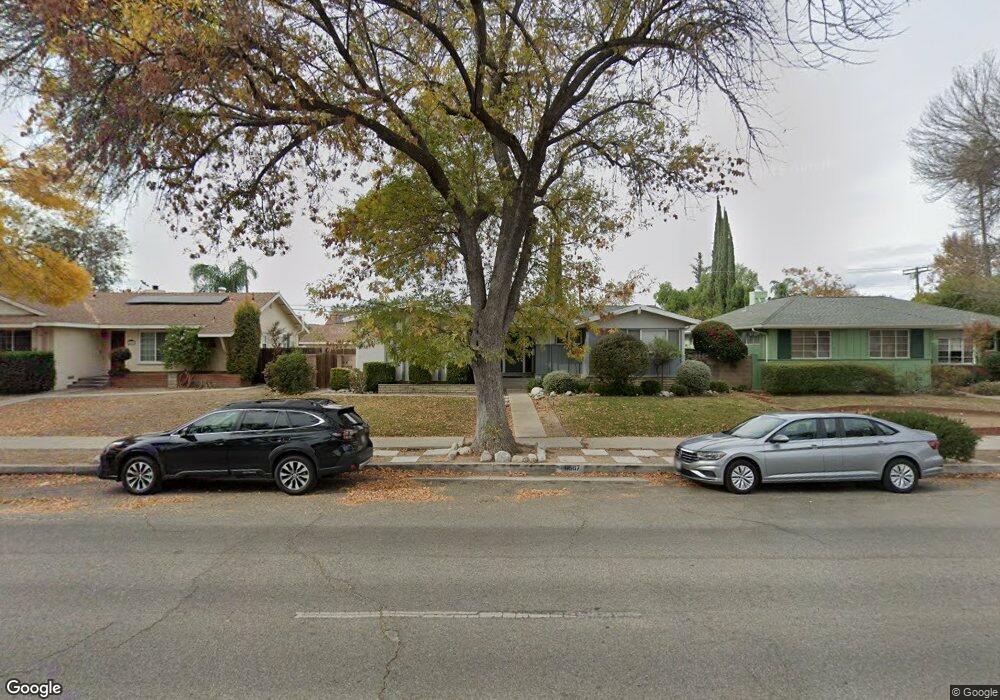
6667 Woodlake Ave West Hills, CA 91307
Estimated Value: $939,878 - $1,187,000
4
Beds
2
Baths
1,448
Sq Ft
$703/Sq Ft
Est. Value
About This Home
This home is located at 6667 Woodlake Ave, West Hills, CA 91307 and is currently estimated at $1,017,970, approximately $703 per square foot. 6667 Woodlake Ave is a home located in Los Angeles County with nearby schools including Hamlin Charter Academy, Enadia Way Technology Charter, and Haynes Charter For Enriched Studies.
Ownership History
Date
Name
Owned For
Owner Type
Purchase Details
Closed on
Jun 12, 2009
Sold by
Hollinger Steve
Bought by
Hardacre David and Hardacre Michelle
Current Estimated Value
Home Financials for this Owner
Home Financials are based on the most recent Mortgage that was taken out on this home.
Original Mortgage
$344,000
Outstanding Balance
$217,581
Interest Rate
4.87%
Mortgage Type
Purchase Money Mortgage
Estimated Equity
$800,389
Purchase Details
Closed on
Mar 4, 2007
Sold by
Hollinger Steve C
Bought by
Hollinger Steve and Hollinger Kelly
Purchase Details
Closed on
Oct 25, 1999
Sold by
Rozema Michael R
Bought by
Hollinger Steve C and Hollinger Kelly Viss
Home Financials for this Owner
Home Financials are based on the most recent Mortgage that was taken out on this home.
Original Mortgage
$175,120
Interest Rate
7.37%
Purchase Details
Closed on
Apr 21, 1997
Sold by
Rozema Cheryl J
Bought by
Rozema Michael R
Create a Home Valuation Report for This Property
The Home Valuation Report is an in-depth analysis detailing your home's value as well as a comparison with similar homes in the area
Home Values in the Area
Average Home Value in this Area
Purchase History
| Date | Buyer | Sale Price | Title Company |
|---|---|---|---|
| Hardacre David | $430,000 | Stewart Title | |
| Hollinger Steve | -- | Accommodation | |
| Hollinger Steve C | $218,900 | Southland Title Company | |
| Rozema Michael R | -- | -- |
Source: Public Records
Mortgage History
| Date | Status | Borrower | Loan Amount |
|---|---|---|---|
| Open | Hardacre David | $344,000 | |
| Previous Owner | Hollinger Steve C | $175,120 |
Source: Public Records
Tax History Compared to Growth
Tax History
| Year | Tax Paid | Tax Assessment Tax Assessment Total Assessment is a certain percentage of the fair market value that is determined by local assessors to be the total taxable value of land and additions on the property. | Land | Improvement |
|---|---|---|---|---|
| 2025 | $6,807 | $555,039 | $361,423 | $193,616 |
| 2024 | $6,807 | $544,157 | $354,337 | $189,820 |
| 2023 | $6,678 | $533,489 | $347,390 | $186,099 |
| 2022 | $6,372 | $523,029 | $340,579 | $182,450 |
| 2021 | $6,290 | $512,774 | $333,901 | $178,873 |
| 2020 | $6,350 | $507,517 | $330,478 | $177,039 |
| 2019 | $6,104 | $497,567 | $323,999 | $173,568 |
| 2018 | $5,998 | $487,812 | $317,647 | $170,165 |
| 2016 | $5,727 | $468,871 | $305,313 | $163,558 |
| 2015 | $5,644 | $461,829 | $300,727 | $161,102 |
| 2014 | $5,499 | $439,000 | $286,000 | $153,000 |
Source: Public Records
Map
Nearby Homes
- 23232 Hartland St
- 6667 Royer Ave
- 6814 Berquist Ave
- 23026 Mobile St
- 23320 Bassett St
- 23238 Victory Blvd
- 23335 Schoolcraft St
- 23036 Victory Blvd
- 6820 Gross Ave
- 23432 Victory Blvd
- 6201 Melba Ave
- 6670 Platt Ave
- 23549 Victory Blvd Unit 21
- 22928 Gault St
- 6227 Glide Ave
- 22835 Styles St
- 7055 Fallbrook Ave
- 22625 Kittridge St
- 6243 Fallbrook Ave
- 6172 Dalecrest Ave
- 6673 Woodlake Ave
- 6661 Woodlake Ave
- 6705 Woodlake Ave
- 6655 Woodlake Ave
- 6666 Bobbyboyar Ave
- 6672 Bobbyboyar Ave
- 6660 Bobbyboyar Ave
- 6704 Bobbyboyar Ave
- 6654 Bobbyboyar Ave
- 6711 Woodlake Ave
- 6649 Woodlake Ave
- 6666 Woodlake Ave
- 6660 Woodlake Ave
- 6672 Woodlake Ave
- 6710 Bobbyboyar Ave
- 6648 Bobbyboyar Ave
- 6654 Woodlake Ave
- 6704 Woodlake Ave
- 6717 Woodlake Ave
- 6643 Woodlake Ave