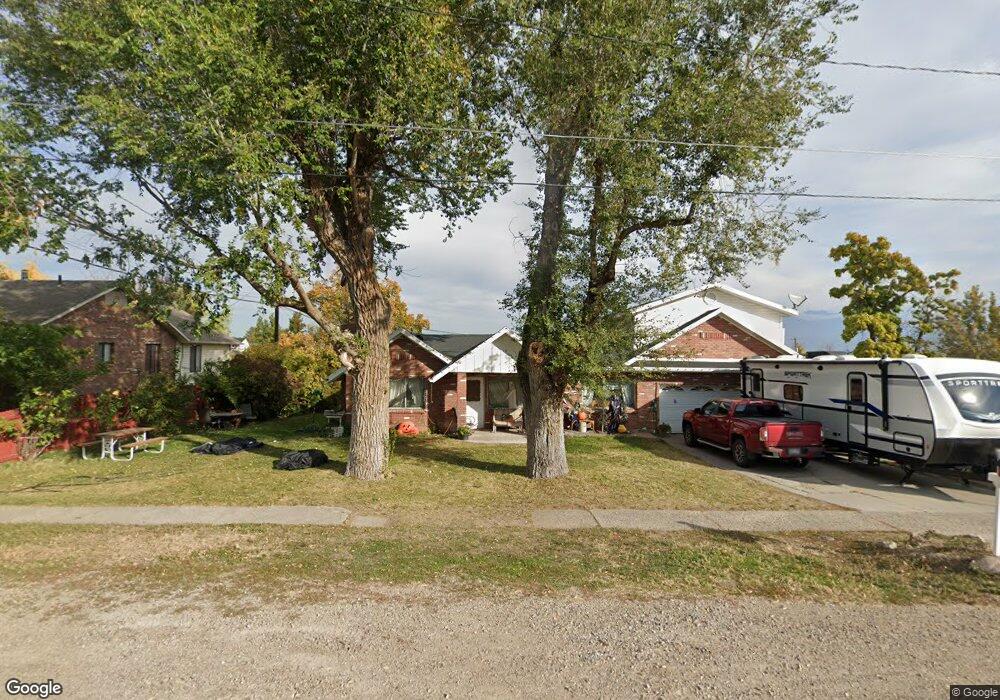
667 E 200 S Payson, UT 84651
Estimated Value: $473,000 - $507,704
4
Beds
3
Baths
3,506
Sq Ft
$139/Sq Ft
Est. Value
About This Home
This home is located at 667 E 200 S, Payson, UT 84651 and is currently estimated at $488,901, approximately $139 per square foot. 667 E 200 S is a home located in Utah County with nearby schools including Barnett Elementary School, Salem Junior High School, and Valley View Middle School.
Ownership History
Date
Name
Owned For
Owner Type
Purchase Details
Closed on
Feb 28, 2012
Sold by
Us Bank National Assn
Bought by
Yates James
Current Estimated Value
Home Financials for this Owner
Home Financials are based on the most recent Mortgage that was taken out on this home.
Original Mortgage
$161,224
Outstanding Balance
$110,961
Interest Rate
3.91%
Mortgage Type
New Conventional
Estimated Equity
$377,940
Purchase Details
Closed on
Jun 13, 2011
Sold by
Ford Gary D
Bought by
Us Bank National Association
Purchase Details
Closed on
Sep 14, 2001
Sold by
Morley David R
Bought by
Morley David Ryan and Morley Shannon Lee
Home Financials for this Owner
Home Financials are based on the most recent Mortgage that was taken out on this home.
Original Mortgage
$147,200
Interest Rate
6.99%
Create a Home Valuation Report for This Property
The Home Valuation Report is an in-depth analysis detailing your home's value as well as a comparison with similar homes in the area
Home Values in the Area
Average Home Value in this Area
Purchase History
| Date | Buyer | Sale Price | Title Company |
|---|---|---|---|
| Yates James | -- | None Available | |
| Us Bank National Association | $182,785 | None Available | |
| Morley David Ryan | -- | Inwest Title Services Inc | |
| Morley David R | -- | Inwest Title Services Inc |
Source: Public Records
Mortgage History
| Date | Status | Borrower | Loan Amount |
|---|---|---|---|
| Open | Yates James | $161,224 | |
| Previous Owner | Morley David R | $147,200 |
Source: Public Records
Tax History
| Year | Tax Paid | Tax Assessment Tax Assessment Total Assessment is a certain percentage of the fair market value that is determined by local assessors to be the total taxable value of land and additions on the property. | Land | Improvement |
|---|---|---|---|---|
| 2025 | $2,274 | $240,350 | -- | -- |
| 2024 | $2,274 | $231,440 | $0 | $0 |
| 2023 | $2,288 | $233,530 | $0 | $0 |
| 2022 | $2,426 | $243,485 | $0 | $0 |
| 2021 | $2,006 | $323,000 | $94,200 | $228,800 |
| 2020 | $1,917 | $301,900 | $85,600 | $216,300 |
| 2019 | $1,767 | $285,400 | $73,900 | $211,500 |
| 2018 | $1,582 | $246,200 | $62,300 | $183,900 |
| 2017 | $1,444 | $120,890 | $0 | $0 |
| 2016 | $1,418 | $117,920 | $0 | $0 |
| 2015 | $1,247 | $103,015 | $0 | $0 |
| 2014 | $1,108 | $92,180 | $0 | $0 |
Source: Public Records
Map
Nearby Homes
Your Personal Tour Guide
Ask me questions while you tour the home.